Network Analysis Operational Research Level 4
680 likes | 1.22k Views
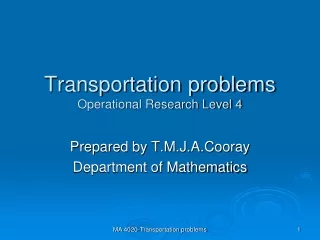
Network Analysis Operational Research Level 4. Prepared by T.M.J.A.Cooray Department of Mathematics. Project Planning. Given: Statement of work written description of goals work & time frame of project Work Breakdown Structure

Network Analysis Operational Research Level 4
E N D
Presentation Transcript
Network AnalysisOperational Research Level 4 Prepared by T.M.J.A.Cooray Department of Mathematics MA 4020 -Network Analysis
Project Planning • Given: • Statement of work • written description of goals • work & time frame of project • Work Breakdown Structure • Be able to: develop precedence relationship diagram which shows sequential relationship of project activities MA 4020 -Network Analysis
Gantt Chart • Popular tool for project scheduling • Graph with bar representing time for each task • Provides visual display of project schedule • Also shows slack for activities • (amount of time activity can be delayed without delaying project) MA 4020 -Network Analysis
A Gantt Chart Month 0 4 2 6 8 10 ½ ½ ½ ½ ½ Activity Design house and obtain financing Lay foundation Order and receive materials Build house Select paint Select carpet Finish work ½ ½ ½ ½ ½ 1 3 5 7 9 MA 4020 -Network Analysis
CPM/PERT • Critical Path Method (CPM) • - DuPont & Remington-Rand (1956) • - deterministic task times • - activity-on-node network construction (AON) • Project Evaluation & Review Technique (PERT) • - U.S. Navy, Booz, Allen & Hamilton • - multiple task time estimates( probabilistic) • - activity-on-arrow network construction (AOA) MA 4020 -Network Analysis
Network Construction • In AON, nodes represent activities & arrows show precedence relationships • In AOA, arrows represent activities & nodes are events for points in time • An event is the completion or beginning of an activity • A dummy shows precedence for two activities with same start & end nodes MA 4020 -Network Analysis
1 2 3 The Project Network Network consists of branches & nodes Node Branch MA 4020 -Network Analysis
1 2 3 Simplified Project Network Construct forms Pour concrete MA 4020 -Network Analysis
Consider the following table which describes the activities to be done to build a house and its sequence Activity predecessors Duration A Design house and obtain financing - 3 B Lay foundation A 2 C Order and receive materials A 1 D Build house B,C 3 E Select paint B,C 1 F Select carpet E 1 G Finish work D,F 1 MA 4020 -Network Analysis
Lay foundation 3 2 Order material Concurrent Activities 3 Lay foundation Dummy 2 4 Order material Incorrect precedence relationship Correct precedence relationship MA 4020 -Network Analysis
Project Network For A House 3 Dummy Lay foundation 0 Build house Finish work 2 3 1 7 6 1 2 4 1 3 Order and receive materials Design house and obtain financing 1 1 Select paint Select carpet 5 MA 4020 -Network Analysis
Critical Path • A path is a sequence of connected activities running from the start to the end node in a network • The critical path is the path with the longest duration in the network • A project cannot be completed in less than the time of the critical path (under normal circumstances) MA 4020 -Network Analysis
All Possible Paths path1: 1-2-3-4-6-7 3 + 2 + 0 + 3 + 1 = 9 months; the critical path path2: 1-2-3-4-5-6-7 3 + 2 + 0 + 1 + 1 + 1 = 8 months path3: 1-2-4-6-7 3 + 1 + 3 + 1 = 8 months path4: 1-2-4-5-6-7 3 + 1 + 1 + 1 + 1 = 7 months MA 4020 -Network Analysis
Early Times(Housebuilding example) • ES - earliest time activity can start • Forward pass starts at beginning of network to determine ES times • EF = ES + activity time • ESij = maximum (EFi) • EFij = ESij + tij • ES12 = 0 • EF12 = ES12 + t12 = 0 + 3 = 3 months i j MA 4020 -Network Analysis
Computing Early Times -ES23 = max (EF2) = 3 months - ES46 = max (EF4) = max (5,4) = 5 months - EF46 = ES46 + t46 = 5 + 3 = 8 months - EF67 =9 months, the project duration MA 4020 -Network Analysis
Late Times • LS - latest time activity can be started without delaying the project • Backward pass starts at end of network to determine LS times • LF - latest time activity can be completed without delaying the project • LSij = LFij - tij • LFij = minimum (LSj) MA 4020 -Network Analysis
Computing Late Times • If a deadline is not given take LF of the project to be EF of the last activity • LF67 = 9 months • LS67 = LF67 - t67 = 9 - 1 = 8 months • LF56 = minimum (LS6) = 8 months • LS56 = LF56 - t56 = 8 - 1 = 7 months • LF24 = minimum (LS4) = min(5, 6) = 5 months • LS24 = LF24 - t24 = 5 - 1 = 4 months MA 4020 -Network Analysis
ES=5, EF=5 LS=5, LF=5 ES=3, EF=5 LS=3, LF=5 ES=8, EF=9 LS=8, LF=9 ES=5, EF=8 LS=5, LF=8 ES=3, EF=4 LS=4, LF=5 ES=0, EF=3 LS=0, LF=3 ES=6, EF=7 LS=7, LF=8 ES=5, EF=6 LS=6, LF=7 Early And Late Times 3 0 2 3 1 7 6 1 2 4 3 1 1 1 5 MA 4020 -Network Analysis
Activity Slack • Slack is defined as the LS-ES or LF-EF • Activities on critical path have ES = LS & EF = LF (slack is 0) • Activities not on critical path have slack • Sij = LSij - ESij • Sij = LFij - EFij • S24 = LS24 - ES24 = 4 - 3 = 1 month MA 4020 -Network Analysis
Total slack/float or Slack of an activity • Total slack/ float means the amount of time that an activity can be delayed without affecting the entire project completion time. • The activity on a given path share the maximum possible slack of the activity along that path according to its share. • Sum of the possible slacks of the activities can not exceed the maximum slack along that path. MA 4020 -Network Analysis
Free slack of an activity • This is the maximum possible delay of an activity which does not affect its immediate successors. • This is evaluated as • FSij = ESj – EFij • FF34=ES4-EF34 =5-5=0 • FF24=ES4-ES24=5-4=1 MA 4020 -Network Analysis
Activity Slack Data Activity ES LS EF LF Slack (S) Free slack 1-2* 0 0 3 3 0 0 2-3 3 3 5 5 0 0 2-4 3 4 4 5 1 1 3-4* 5 5 5 5 0 0 4-5 5 6 6 7 1 0 4-6* 5 5 8 8 0 0 5-6 6 7 7 8 1 1 6-7* 8 8 9 9 0 0 * Critical path MA 4020 -Network Analysis
0 2 4 6 8 10 • Activity • Design house and • obtain financing • Lay foundation • Order and receive • materials • Build house • Select paint • Select carpet • Finish work 1 3 5 7 9 MA 4020 -Network Analysis
a + 4m + b t = Mean (expected time): 6 b - a ( ) Variance: s 2 = 6 Probabilistic Time Estimates • Reflect uncertainty of activity times • Beta distribution is used in PERT 2 where, a = optimistic estimate m = most likely time estimate b = pessimistic time estimate MA 4020 -Network Analysis
Example Beta Distributions P (time) P (time) m t a b a t m b P (time) a b m = t MA 4020 -Network Analysis
PERT Example Equipment testing and modification 2 6 Final debugging Dummy Equipment installation System Training 1 3 5 8 9 System development Manual Testing System changeover System Testing Job training Dummy Position recruiting Orientation 4 7 MA 4020 -Network Analysis
Activity Information Time estimates (wks) Mean Time Variance Activity a m b t s2 1 - 2 6 8 10 8 .44 1 - 3 3 6 9 6 1.00 1 - 4 1 3 5 3 .44 2 - 5 0 0 0 0 .00 2 - 6 2 4 12 5 2.78 3 - 5 2 3 4 3 .11 4 - 5 3 4 5 4 .11 4 - 7 2 2 2 2 .00 5 - 8 3 7 11 7 1.78 5 - 7 2 4 6 4 .44 7 - 8 0 0 0 0 .00 6 - 9 1 4 7 4 1.00 8 - 9 1 10 13 9 4.00 MA 4020 -Network Analysis
Early And Late Times Activity t s2 ES EF LS LF S FS? 1 - 2 8 0.44 0 8 1 9 1 1 - 3 6 1.00 0 6 0 6 0 1 - 4 3 0.44 0 3 2 5 2 2 - 5 0 0.00 8 8 9 9 1 2 - 6 5 2.78 8 13 16 21 8 3 - 5 3 0.11 6 9 6 9 0 4 - 5 4 0.11 3 7 5 9 2 4 - 7 2 0.00 3 5 14 16 11 5 - 8 7 1.78 9 16 9 16 0 5 - 7 4 0.44 9 13 12 16 3 7 - 8 0 0.00 13 13 16 16 3 6 - 9 4 1.00 13 17 21 25 8 8 - 9 9 4.00 16 25 16 25 0 MA 4020 -Network Analysis
ES=8, EF=13 LS=16 LF=21 ( ) ES=0, EF=8 LS=1, LF=9 ES=13, EF=17 LS=21 LF=25 ( ) ( ) ES=8, EF=8 LS=9, LF=9 ( ) ES=0, EF=6 LS=0, LF=6 ES=9, EF=16 LS=9, LF=16 ( ) ( ) ES=6, EF=9 LS=6, LF=9 ES=16, EF=25 LS=16 LF=25 ( ) ( ) ES=9, EF=13 LS=12, LF=16 ( ) ES=0, EF=3 LS=2, LF=5 ( ) ES=13, EF=13 LS=16 LF=16 ES=3, EF=7 LS=5, LF=9 ( ) ( ) ES=3, EF=5 LS=14, LF=16 ( ) Network With Times 2 6 5 8 4 0 3 9 8 1 3 5 9 6 7 0 4 3 4 2 4 7 MA 4020 -Network Analysis
Project Variance Project variance is the sum of the variances along the critical path s2 = s2 13 + s2 35 + s2 58 + s2 89 = 1.00 +0.11 + 1.78 + 4.00 = 6.89 weeks MA 4020 -Network Analysis
Probabilistic Network Analysis Determine the probability that a project is completed (project completion time is ) within a specified period of time where m = tp = project mean time s = project standard deviation x = project time (random variable) Z = number of standard deviations of x from the mean (standardized random variable) x - m Z = s MA 4020 -Network Analysis
Normal Distribution Of Project Time Probability Zs m = tp x Time MA 4020 -Network Analysis
Standard Normal Distribution Of transformed Project Time Probability Z m =0 z Time MA 4020 -Network Analysis
Probabilistic Analysis Example What is the probability that the project is completed within 30 weeks? P(X 30) = ? s2 = 6.89 weeks s= 6.89 = 2.62 weeks Z = x - m =30 - 25 = 1.91 P(Z 1.91) = ? s 2.62 MA 4020 -Network Analysis
. . . . . . . . . Determining Probability From Z Value Z 0.00 0.01 .. 04 … 0.09 1.1 0.3643 0.3665 0.3729 1.9 0.4713 …0.4767 +0.4719 P( x < 30 weeks) = 0.50+ 04719 = 0.9719 m = 25 x = 30 Time (weeks) MA 4020 -Network Analysis
What is the probability that the project will be completed within 22 weeks? 22 - 25 -3 2.62 2.62 = = -1.14 Z = P(Z< -1.14) = 0.1271 x = 22 m = 25 x=28 Time (weeks) P( x< 22 weeks) = 0.1271 MA 4020 -Network Analysis
Benefits of PERT/CPM • Useful at many stages of project management • Mathematically simple • Uses graphical displays • Gives critical path & slack time • Provides project documentation • Useful in monitoring costs MA 4020 -Network Analysis
Advantages of PERT/CPM Networks generated provide valuable project documentation and graphically point out who is responsible for various project activities Applicable to a wide variety of projects and industries Useful in monitoring not only schedules, but costs as well MA 4020 -Network Analysis
Limitations of PERT/CPM • Assumes clearly defined, independent, & stable activities • Specified precedence relationships • Activity times (PERT) follow beta distribution • Subjective time estimates • Over-emphasis on critical path MA 4020 -Network Analysis