Download
1 / 22
230 likes | 395 Views
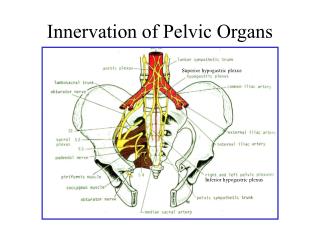
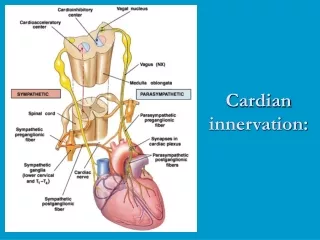
עבוד אותות במערכת החושים סמסטר א' תשס"ח הרצאה מס' 5 http://www.eng.tau.ac.il/~mira/Senses2008 Neural Activity. IHC and OHC Afferent innervation pattern. IHC E fferent Innervation. Lateral olivary complex fiber s synapse on type I afferents coming from IHC.

E N D
עבוד אותות במערכת החושיםסמסטר א' תשס"חהרצאה מס' 5http://www.eng.tau.ac.il/~mira/Senses2008Neural Activity
IHCEfferent Innervation Lateral olivary complex fibers synapse on type I afferents coming from IHC Afferent fibers synapse with brain stem at the cochlear nuclei
Sound encoding by acoustic neuron
SpontaneousNeural Activity (1) Stationary
SpontaneousNeural Activity (2) Correlation
SpontaneousNeural Activity (4) The spontaneous neural activity can be described as: • A stationary, renewal process. • The length of successive intervals are statistically independent. Thus • The probability density function of interval length describes the process
SpontaneousNeural Activity (5) • - Interval length n – number of spikes in the interval T
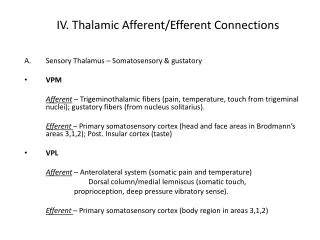
Input-Output Function of a Single Auditory Nerve Fiber This figure shows the input-output function of a single fiber. Notice that the firing rate of the neuron increases as the stimulus intensity increases within its dynamic range, and eventually plateaus.
threshold saturation Auditory nerve rate-intensity functions In general, the auditory nerve fibers that have higher levels of spontaneous activity (HSR), have lower thresholds and lower saturation points. The fibers that have lower levels of spontaneous acitivity (LSR), have higher thresholds and higher saturation points