Microbial Source Tracking in Two Southern Maine Watersheds
Microbial Source Tracking in Two Southern Maine Watersheds. NEERS/SNECAFS Joint Meeting, May 9, 2003

Microbial Source Tracking in Two Southern Maine Watersheds
E N D
Presentation Transcript
Microbial Source Tracking in Two Southern Maine Watersheds NEERS/SNECAFS Joint Meeting, May 9, 2003 Project Author: Kristen Whiting-Grant, Maine Sea Grant Cayce Dalton*, AmeriCorps/Maine Conservation CorpsFred Dillon*, U Southern Maine-Muskie School for Public Service Steve Jones, Jackson Estuarine Lab, U New HampshireMichele Dionne, Wells National Estuarine Research Reserve* presenters
Project Partners Funded by a grant from:Cooperative Institute forCoastal and EstuarineEnvironmental Technology (CICEET) In cooperation with partners from:
What is Bacterial Pollution? Indicates presence of fecal matter in water. Risk of illness from water contact. Grounds for shellfish bed closure.
Sources of Bacterial Pollution? • Unmanaged livestock/pet waste • Leaking sewer pipes/storm overflows • Wildlife (incl. mammals and birds) • Malfunctioning septic systems
Importance of Bacteria as Water Quality Indicators • Inexpensive surrogate for fecal pathogens. • Countable, not just presence/absence. • Regulatory standards for shellfish areas and recreational waters.
What is Microbial Source Tracking? • ID strains of indicator bacteria or virus • Phenotypic or Genotypic methods • Unknown strains from environment compared to strains found in host animals • Close matches are a basis for source identification • Experimental technique, gaining attention EXPERIMENTAL!
Deer Scat Water Sample • Addresses biggest weakness of conventional bacterial tests: not source specific. • Knowing sources means corrective measures focused, saving public resources and reducing frustration. • Example: Expensive sewer extension in Wells, Maine, did not significantly reduce fecal coliform levels in Little River Estuary. Why Use MST?
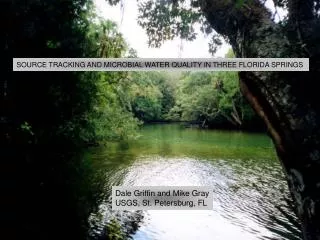
Local Need: History of fecal contamination in So. ME resultsin closed clam flats. Mirrors state & national issue.
Wells Beach enjoys significant tourism (despite shark).Bacteria = public health issue.
MST Step 1: Intensive Water Sampling Sample freshwater tributaries of estuary during winter clamming season. Half of sampling during post-storm, snowmelt or high flow conditions. Test is membrane filtration using mTEC + urea for E. coli.
MST Step 2: Collect Fecal Samples For Reference Library E. coli obtained from about 10 fecal samples. Includes 3 human (septic, sewage, direct fecal). Includes other probable sources: dog, deer, cow, raccoon, etc.
MST Step 3: Select and Save Bacteria Samples with high E. coli are identified. 10 bacteria are isolated on TSA and refrigerated. Isolates transported to Jackson Estuarine Lab for ribotyping within about two weeks.
All water samples tested for E. coli Over ten months, 390 water samples were collected and filtered.
From samples with high E. coli, bacteria are isolated Isolates were made from 136 of 390 water samples. (Ten bacterial isolates per water sample.)
From isolates, a few representative samples are ribotyped Genetic analysis conducted on 27 of 390 water samples. We counted 22,856 bacterial colonies. 159 were ribotyped.
Source Species Database Species Species MEME & NHMEME & NH Pets617Livestock/chickens46 Cat -- 2 Cow -- 30 Dog 6 15 Horse -- 14 Humans40 86 Chicken -- 2 Human 10 14 Birds248 Septage 17 17 Cormorant -- 13 Wastewater 13 55 Duck -- 4 Wildlife23116 Goose -- 19 Coyote 10 15 Grouse 2 2 Deer 3 41 Pigeon -- 2 Grey Fox 3 3 Robin -- 3 Muskrat -- 3 Seagull -- 5 Raccoon 4 28 Red Fox 3 26 TOTAL 75 317 159 bacterial colonies from streams/estuary ribotyped. Compared to 75 bacterial colonies from watershed. Compared to 317 bacterial colonies from ME-NH region.
Results of MST in Maine: MST on small subset of samples. Detailed view of geographic distribution of bacteria.
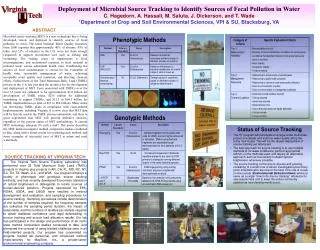
Ribotyping:LabProcedures • DNA extracted & purified. • DNA digested w/restriction enzyme. • DNA separated via gel electrophoresis. • DNA denatured & blotted onto membrane. • Hybridization with E. coli rRNA DNA probe. • DNA exposed to a chemiluminescent substrate & digitally imaged. • Image enhanced & optimized in computer.
Ribotyping:Data Analysis • DNA patterns are analyzed by cluster analysis and by computing a similarity coefficient. • Source species identification for sample patterns based on degree of matching to source species patterns.
Human = 93% similarity Matching ribotype gel banding patterns: Which of these patterns is most similar to the unknown?
Researcher Sets Similarity Criteria Researcher must decide what tolerance and percent similarity qualify as a match: Higher standard means greater certainty but potentially too few matches. Of 159 ribotyped isolates:at >80%, 112 had source-ID at >85%, 70 would have source-ID at >90%, 30 would have source-ID at >95%, 10 would have source-ID
Results of Ribotyping in Webhannet Watershed: Local Source Library Birds 0%* Wildlife 24% Livestock 0%* Unknown 47% Pets 11% HUMAN 18% * not in library Largest single source: Human (18% of 53% known) Largest category: Wildlife (24% of 53% known)
Results of Ribotyping in Webhannet Watershed: Regional Source Library Birds 3% Livestock 11% Unknown 30% Wildlife 29% HUMAN 18% Pets 9% Largest single source: Human (18% of 70% known) Largest category: Wildlife (29% of 70% known)
CONCLUSIONS • Webhannet report being drafted now. Awaiting steering committee input re: management ideas. • Results provide data in place of speculation. • As more regional MST is conducted, library size should expand and % unknown diminish. • Perhaps most useful when one or two major sources are suspected and impact is severe. • Driven by need and interest, the basic science underlying MST is being researched further.