Download
1 / 30
300 likes | 420 Views
This study by Nancy M. White and collaborators from various institutions investigates microbial source tracking (MST) in watershed areas, focusing on practical implementations and research methods for assessing water quality. Conducted across multiple sites, including Jumping Run Creek and Croatan National Forest, the research evaluates the impacts of land use on bacterial loading and antibiotic resistance. Key findings highlight the challenges in source identification and the efficacy of MST methods, emphasizing the need for improved management strategies to address water quality standards.

E N D
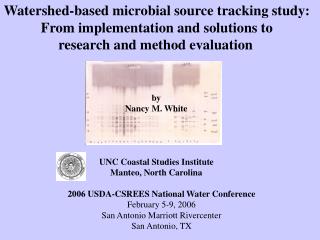
Watershed-based microbial source tracking study: From implementation and solutions to research and method evaluation by Nancy M. White UNC Coastal Studies Institute Manteo, North Carolina 2006 USDA-CSREES National Water ConferenceFebruary 5-9, 2006San Antonio Marriott RivercenterSan Antonio, TX
Cooperators and ParticipantsUNC Coastal Studies Institute UNC-Institute of Marine SciencesNCSU CMASTNC Division of Health, Shellfish Sanitation Program Duke Marine LaboratoryNCSU Water Quality Group NOAA/NOS Center for Coastal Environmental Health and Bimolecular Research Carteret Craven Electric CooperativeJumping Run Creek Watershed CitizensCroatan National Forest Open Grounds FarmUSDA-CSREESNCDENR Division of Water Quality, 319 ProgramNC Clean Water Management Trust FundNC Wetland Restoration Program
Pamlico Sound Cape Hatteras/Outer Banks Neuse River Estuary Croatan National Forrest Open Grounds Farm Jumping Run Creek APES Region Bogue Sound
Research Site #1: Jumping Run Creek, residential, light commercial
Landscape Assessment Location Visits SV Dogs MHP 47 0 23 Med. Density 66 2 60 Low Density 14 0 7 Campground 1 0 0 Totals 128 2 90 *Does not include Roads Location Cats Other Imperviousness MHP 6 3 40,000sft Med. Density 47 25 185,000 Low Density 0 0 95,000sft Campground 0 0 5,000sft Totals 53 28 325,000 sft * or 7.5 acres, with roads, less than 10% imperviousness.
Flow Assessment • Information is using to determine ditch drainage patterns, water movement • direction and timing, as well as dilution and dispersion
Storm Event Monitoring Develop rainfall / runoff relationships, flow volumes, loading calculations.
1967 Land use change assessment 1979 1988 1994
Ranking and classification process Vegetation: Rank Percent Cleared 1 1-20% 2 21-40% 3 41-60% 4 61-80% 5 81-100% Impervious Surfaces: 1 1-20% 2 21-40% 3 41-60% 4 61-80% 5 81-100% HydroMod 1 no ditches evident 2 1 lot-edge ditch 3 2 side ditches 4 direct discharge 5 Channelized Note Cover Type – grass, forest, sand.
Integrated Event and MST Monitoring • Added farm and forest sample sites • Added a variety of MST methods—ARA, ribotyping, and QPCR using Enterococci speciation and Bacteroides sp. (R. Noble)
Site # 2 South River: Open Grounds Farm Land cover: Cultivated row crop agriculture
Pettiford Creek - Croatan National Forest Land cover: Managed mixed forest of pine and pocosin
Comparative loading of indicator bacteria Graph courtesy Dr. Rachel Noble
Mar Process e. coli isolates are developed for each sample, both library and water, and tested for multiple antibiotic resistance. Data were used to develop species and site indices meant to indicate risks for health risk dependant upon probable source of the pathogens.
ANTIBIOTIC RESISTANCE INDEX FOR JUMPING RUN, PETTIFORD CREEK AND OPEN GROUNDS FARM Site Antibiotic Resistance Index = (number of resistant tests for a site/total number of tests)
CROATAN ALL # OF ISOLATES 95 # OF TESTS 855 # OF RESISTANT TESTS 19 SITE AR INDEX 19/855 = .022 EMC ALL # OF ISOLATES 384 # OF TESTS 3456 # OF RESISTANT TESTS 158 SITE AR INDEX 158/3456 = .046 OGF ALL # OF ISOLATES 153 # OF TESTS 1377 # OF RESISTANT TESTS 17 SITE AR INDEX 17/1377 = .012
Comparison AR index from Webster et al., 2004 Kaspar et al., 1990 n/a Developed .09 Rural .03 Parveen et al., 1997 Point Source .25NPS .13 n/a Webster et al., 2004 WWTP .12Developed .03Rural .01 CSI Human .09Pet/urban .005Wildlife .015
Aggregate Results of the Replicate Test 144 antibiotic replicates per isolate, 30 isolates per drug for isolates which previously demonstrated resistance
Summary • High levels of bacterial loading is occurring in all land use types—loads at baseflow would still violate both recreational and shellfish water quality standards. • ARA results for both the index and split-duplicate results indicate unreliability in the response patterns for e coli calling into question is usefulness as a environmental source tracking method. Are the cells derived from the sediments, possibly being “old”? • Good example of situation where waters are impaired (TMDL), but is the source and transport vector? What management action should be taken? Of note is that flow volume which triggers runoff, Croatan National Forest requires more than 2-3” of rain to generate enough runoff to generate stream flow. Just reducing the volume of storm event flow would provide some relief, but how much?
Next Steps • Ribotyping method assessment to standardize scanning resolution and track delineation and measurement methods are complete—finishing the analyses of the matching rate currently being conducted. • Dr. Nobles QPCR • Shea, Hyman and Gebreyes research into the antibiotic resistance, pathogen identification and salmonella resistance (with livestock farm) is underway. • Currently analyzing loading rates for • various portions of the hydrograph (before peak, • after peak, tailwater and baseflow) to see if • there is any information that can be gleaned • and in comparison with nutrients and TSS.