Download
1 / 43
430 likes | 671 Views
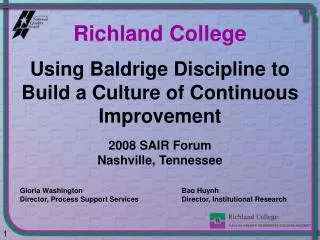
Richland College. Using Baldrige Discipline to Build a Culture of Continuous Improvement. 2008 SAIR Forum Nashville, Tennessee. Gloria Washington Director, Process Support Services. Bao Huynh Director, Institutional Research. 1. Overview. The Baldrige Journey

E N D
Richland College Using Baldrige Discipline to Build a Culture of Continuous Improvement 2008 SAIR ForumNashville, Tennessee Gloria Washington Director, Process Support Services Bao Huynh Director, Institutional Research 1
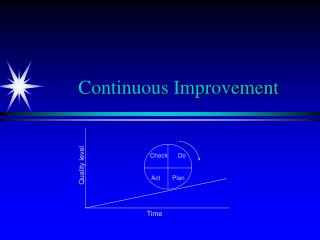
Overview • The Baldrige Journey • Measurement System Development • Monthly Report Card • End of Year Report • Lessons to Share 2
The Baldrige Journey • Continuous Improvement Timeline • A-D-L-I • Agility and Innovation • The Wise Socratic Teacher 3
Richland’s Journey to Excellence 2002, 2003, 2004MB Application Consensus Level 2001 MB ApplicationStage 1 2006-2010Sustaining discipline Reinventing Richland 2005MB Site Visit 2011Reapply 2011Reapply 1993CQITQM 1997TAPE Level II Assessment 2003, 2004TAPE Application Site Visit 2005TAPE Site Visit 4
Approach Deploy Integrate Learn Cycles of Improvement ADLI 5
Agility and Innovation Changing Ahead of the Curve “Many institutions wait too long to attempt transformations, doing so only when the signs of trouble have become obvious… High performers by contrast, change before they must, knowing that the best way to transform is from a position of strength.” Source:Breene, Tim, Shill, Walter E., & Nunes, Paul F. (2007). Transformation: Changing Ahead of the Curve. Retrieved June 29, 2007 from http://www.accenture.com/Global/Research_and_Insights/ Outlook/By_Issue/Y2007/ChangingAheadCurve.htm 6
Developing a Robust Measurement System • Strategic Planning Priority Goals • Key Performance Indicators • Measures and Targets • Institutional and Departmental Actions • Review, Revise, and Refine 8
Richland’s Four Strategic Planning Priority Goals • Identify and Meet Community Educational Needs (20%) • Enable All Students to Succeed (35%) • Enable All Employees to Succeed (20%) • Ensure Institutional Effectiveness (25%) 9
Identify and Meet Community Educational Needs • Initiate Proactive Community Relationship Building (5%) • Conduct Open, Regular Communication with Community Stakeholders (10%) • Increase Enrollment in Service Area Underserved Populations (15%) • Provide Business and Industry Work Force Training (20%) • Respond to Community Educational Needs (50%) 10
Enable All Students to Succeed • Monitor and Improve Student Success (40%) • Monitor and Improve Success for Historically Underserved Student Groups (40%) • Promote Student Engagement and Satisfaction with Services to Support Student Learning (20%) 11
Enable All Employees to Succeed • Promote Excellence in Job Performance (15%) • Provide Excellence in Job Satisfaction (10%) • Provide Comprehensive Professional Development for All Employee Groups (25%) • Proactively Manage Turnover and Diversity (25%) • Provide a Safe and Healthy Working Environment (25%) 12
Ensure Institutional Effectiveness • Remain Fiscally Responsible and Sound (35%) • Meet and Exceed Internal and External Standards and Requirements (35%) • Improve Operational Productivity (30%) 13
Measures and Targets • Rationale for Measures • Strategic vs. Operational • Target Setting Methodology • Cycles of Improvement • Review, Revise, and Refine 14
2008-2009 Target Range 90% – 100% 2010-2011 Target Range 90% - 100% 2012-2013 Target Range 90% - 100% 379,390 – 421,544 433,994 – 482,216 547,394 – 608,216 Goals, KPIs, Measures, Targets 1.1.1 Contact hours from dual credit and tech-prep 16
2008-2009 Target Range 90% – 100% 2010-2011 Target Range 90% - 100% 2012-2013 Target Range 90% - 100% 1,086,201 – 1,206,890 1,140,510 – 1,267,233 1,197,535 – 1,330,594 Goals, KPIs, Measures, Targets 1.5.1 # of on-line contact hours 17
Formalizing the Informal • Organizational Action Plans (OAP) • Departmental Action Plans (DAP) • Process Improvement/Implementation Plans (PIIP) • Benchmarking Improvement Plans 18
Identify Improvement Need Assign Ownership Evaluate the Process 1 8 2 RLC Evaluation & Improvement Approach Identify Root Cause Disseminate Results 7 3 Measure Impact Develop Solution Pilot/ Implement Approach 6 4 5 Process Improvement (PIIP) Integrate Approach Learn Deploy 21
Monthly Report Card • The “Thunion” - Thunder Onion • How it Works • Raw Data Sheet • Layer 3 • Layer 2 • The Dashboard 24
How It Works 25
2007-2008 Target Range 90% – 100% Performance as of August 2008 Score Adjusted Score 360,000 – 400,000 441,515 11.04 10.00 Thunion Report - Raw Data 1.1.1 Contact hours from dual credit and tech-prep 30
2007-2008 Target Range 90% – 100% Performance as of August 2008 Score Adjusted Score 832,500 – 925,000 1,096,500 11.85 10.00 Thunion Report - Raw Data 1.5.1 # of on-line contact hours 31
2007-2008 Target Range 90% – 100% Performance as of August 2008 Score Adjusted Score 675 – 750 883 11.77 10.00 Thunion Report - Raw Data 2.1.14 # of students completing core curriculum 32
End of Year Report • Purpose • Key Findings • Strategic Emphases • Cycles of Improvement • Application for Strategic Planning 33
Target Range > 3.15 - 3.50Performance = 3.43% of max. target range = 98.00% Employee Satisfaction with Recognition Results Source: Campus Quality Survey, 98,00,02,05,07 34
Target Range > 675-750Performance = 685% of max. target range = 91.30% Core Completion Source: DCCCD Colleague System 35
Target Range > 293-325Performance = 255% of max. target range = 78.50% Core Completion for Target Groups Source: DCCCD Colleague System 36
Target Range > 207,000 - 230,000Performance = 290,264% of max. target range = 126.20% Dual-Credit Contact Hours Source: DCCCD Colleague System 37
Strategies for Increasing Dual Credit Market Share • RCHS Established • Increased Dual Credit staff • Targeted Outreach to: • service area high schools • home schooled students 38
Distance Learning Contact Hour Trends Source: DCCCD Colleague System 39
Strategies for Increasing Distance Learning Market Share • Schedule Analysis & Efficiency • Faculty Professional Development • In-house Course Development • High Student/Faculty Engagement • Online Tutoring • Quality Assurance 40
Ensuring DL Quality Source: DCCCD Colleague System 41
Lessons to Share • Start Where You Are • Keep it Simple - Draw Pictures • Communicate Continuously • Integrate with the Whole • Deploy to Build a Culture of Performance Excellence • Continuously Evaluate and Improve 42
Richland College Using Baldrige Discipline to Build a Culture of Continuous Improvement 2008 SAIR ForumNashville, Tennessee Gloria Washington Director, Process Support Services Bao Huynh Director, Institutional Research 43