Download

1 / 37
370 likes | 393 Views
test review<br>middle high school math<br>system of equations<br>algebra 1

E N D
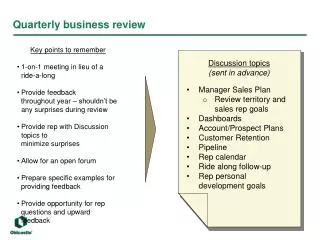
scented candle day! 11.01.22 Take out your spiral. Prepare to make a list of study topics. Log into chromebook. Agenda: • Quarterly Topics • Quarterly Review • Delta Math only keep one Pencil, Calculator, Chromebook, Spiral
Quarterly Assessment #1: • Function Families • Domain & Range • Arithmetic Sequences (nth term, explicit formula) • Slope/Average Rate of Change • Parallel & Perpendicular Lines • Forms of Lines (Slope-Intercept, Standard, Point-Slope) • Linear Regressions, Correlation Coefficients • Systems of Equations (Graphing, Substitution, Elimination) • Literal Equations
Which graph represents the weakest correlation between variables? Linear Regression Review
Which graph represents the weakest correlation between variables? Linear Regression Review
Directions: The linear regression equation below models the relationship between the age of a used car, x, in years and the price of the used car, y: y = -528.6x + 9250 Which of the following statements best describes the rate of change in the price of the car? • The initial price of the car is approximately $9,250. • The initial price of the car is approximately $528. • The price of the car decreases approximately $9,250 every ten years. • The price of the car decreases approximately $528 every year. Linear Regression Review
Directions: The linear regression equation below models the relationship between the age of a used car, x, in years and the price of the used car, y: y = -528.6x + 9250 Which of the following statements best describes the rate of change in the price of the car? • The initial price of the car is approximately $9,250. • The initial price of the car is approximately $528. • The price of the car decreases approximately $9,250 every ten years. • The price of the car decreases approximately $528 every year. Linear Regression Review
Function Families Which of the above graph, table, and mapping is a function? • Graph A and Table B B. Table B and Mapping C C. Graph A only D. Mapping C only
Function Families Which of the above graph, table, and mapping is a function? • Graph A and Table B B. Table B and Mapping C C. Graph A only D. Mapping C only
Which of the following statements about the function graphed to the left is true? • The Domain is x > -3 • The Domain is all real numbers • The Range is -3 < y < 6 • The Range is All Real Numbers Function Families
Which of the following statements about the function graphed to the left is true? • The Domain is x > -3 • The Domain is all real numbers • The Range is -3 < y < 6 • The Range is All Real Numbers Function Families
The water level of a stream often rises several inches after a severe storm. Let the water level of a stream x days after a storm passes be represented by the function L(x). What is the correct interpretation of: L(4) = 18 • The water level rose 4 inches over the next 18 days. • The water level rose 4 inches per day over the next 18 days. • The water level is 4 inches after 18 days. • The water level is 18 inches after 4 days. Function Families
The water level of a stream often rises several inches after a severe storm. Let the water level of a stream x days after a storm passes be represented by the function L(x). What is the correct interpretation of: L(4) = 18 • The water level rose 4 inches over the next 18 days. • The water level rose 4 inches per day over the next 18 days. • The water level is 4 inches after 18 days. • The water level is 18 inches after 4 days. Function Families
The equation of a line is: y - 2 = 2(x + 3) Which of the following statements about this line is true? Select ALL that apply. Forms of Lines
The equation of a line is: y - 2 = 2(x + 3) Which of the following statements about this line is true? Select ALL that apply. Forms of Lines
a10 = 1 + ⅓ (10 - 1) a10 = 1 + ⅓ (9) a10 = 1 + 3 a10 = 4 Arithmetic Sequence
For which set of ordered pairs will the slope between the two points be -4? Rate of Change and Slope
For which set of ordered pairs will the slope between the two points be -4? Rate of Change and Slope
Which graph has a slope of 0.5? Rate of Change and Slope
Which graph has a slope of 0.5? Rate of Change and Slope
The table below gives the height of a soccer ball t seconds after it was kicked. Rate of Change and Slope What is the average rate of change from time t = 0.25 to time t = 1?
The table below gives the height of a soccer ball t seconds after it was kicked. 16 - 7 1 - 0.25 m = 9 0.75 m = Rate of Change and Slope m = 12 What is the average rate of change from time t = 0.25 to time t = 1?
The table below gives the height of a soccer ball t seconds after it was kicked. For which interval of time is the average rate of change the greatest? Rate of Change and Slope
The table below gives the height of a soccer ball t seconds after it was kicked. For which interval of time is the average rate of change the greatest? m = 28 Rate of Change and Slope m = 20 m = 15 m = 4
Directions: Enter the data from the table into your Desmos graphing calculator. Determine the linear regression equation. Round the slope and y-intercept to the hundredths place. Linear Regression Review
Directions: Enter the data from the table into your Desmos graphing calculator. Determine the linear regression equation. Round the slope and y-intercept to the hundredths place. y = 2.31x + 32.59 Linear Regression Review
Directions: Enter the data from the table showing the relationship between the amount of money companies spend on advertising and the amount of the company's sales into your Desmos graphing calculator. Calculate the linear regression model for the data and round the values to the nearest tenth. Linear Regression Review
Directions: Enter the data from the table showing the relationship between the amount of money companies spend on advertising and the amount of the company's sales into your Desmos graphing calculator. Calculate the linear regression model for the data and round the values to the nearest tenth. y = 176.8x + 112.6 Linear Regression Review
Due Date: WEDNESDAY, November 2nd