Download
1 / 128
1.28k likes | 1.3k Views
Topic 2: Portraying Earth: Using Maps, Remote Sensing and GIS. Introduction to Maps: - What is a Map? - Benefits of Maps - Marginal information on Maps - Map Scale - Map Projections: - Cylindrical Projections - Plane Projection - Conic Projection

E N D
Topic 2: Portraying Earth: Using Maps, Remote Sensing and GIS • Introduction to Maps:- What is a Map?- Benefits of Maps- Marginal information on Maps- Map Scale- Map Projections: - Cylindrical Projections - Plane Projection - Conic Projection • Incoming Solar Radiation:- Electromagnetic Spectrum- Insolation- Daily Insolation Pattern
Topic 2: Portraying Earth: Using Maps, Remote Sensing and GIS - Map Projections: - Equivalent Projection - Conformal Projection • Remote Sensing: - Aerial Photographs - Orthophoto Maps - Visible light & Infrared Sensing - Thermal Infrared Sensing - Microwave Sensing
Topic 2: Portraying Earth: Using Maps, Remote Sensing and GIS • Remote Sensing: - Microwave Sensing - Multispectral Remote Sensing • Geographic Information Systems (GIS) - What is GIS - GIS Automation Tools • Isolines and Applications
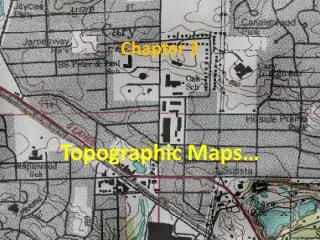
Introduction to Maps: What is a Map? • Geographic information describing earth’s surface features are often displayed by geographers on: - maps: examples include road map, topographic map, surveyor’s map, etc)- aerial photographs - satellite imageries - GIS, etc
Introduction to Maps: Benefits of Maps? • A map is a two-dimensional representation of the spatial distributions of features of interest in a place or region • Maps show spatial relationships between features, especially:- direction- distance- size and shape
Introduction to Maps: What is a Maps? • May provide clue why things are located where they are • The main purpose of maps is to show the spatial distribution of one or more features of interest
Orthophoto Map Topographic Map Geologic Map - Rock Types Road Map
Introduction to Maps: Benefits of Maps? • Benefits of Maps:- Map is the geographer’s most important tool - Represents earth’s features on a flat paper - it shows spatial relationships with great efficiency- It can show true courses for navigation and true shapes of earth’s features
Introduction to Maps: Benefits of Maps? • Benefits of Maps:- It can be used to measure areas and distances- It can be reproduced easily and inexpensively- It is easier to handle and transport- It is often smaller than the areas they represent and contains less details
Introduction to Maps: Benefits of Maps? • Benefits of Maps:- The accuracy and amount of information contained in a map will depend on its scale and projection • Disadvantages of Maps: - It distorts the earth in some ways, hence could not depict the earth with complete accuracy
Introduction to Maps: Benefits of Maps? • Disadvantages of Maps: - Map distortions become progressively pronounced as the part of the globe depicted gets larger
Introduction to Maps – Map Scale Map Scale: • Scale is a mathematical expression or statement of a relationship between distances or sizes on map and their actual measurements on the ground • Types of scale: 1. Statement Scale or Verbal or Word Scale 2. Fractional Scale and 3. Graphical Scale
Types of Map Scale Three Types of Map Scale
Introduction to Maps – Map Scale Map Scale: • Statement Scale or Verbal or Word ScaleA scale stating in words the distance on map compared to the actual distance on the groundExample: one inch on the map represents one mile on the ground or 1 inch = 1 mile) • Representative Fraction or Ratio Scale A scale in which map distance is represented as a proportional number of its actual distance on the ground
Introduction to Maps – Map Scale Example: 1:63360 or 1/63360, meaning a unit length on the map equals 63360 units on the ground- Common Ratio Scales used on maps: a. world map (1:264,000,000) b. road map of a state (1:1,000,000 to 1:2,000,000) c. street map of a city (1:10,000) d. residential lot (1:100)
Introduction to Maps – Map Scale • Graphical or Bar Scale: A scale shown as a line marked off in graduated distances
Introduction to Maps – Map Scale • Graphical or Bar Scale: A major advantage is that it remains valid when map is reduced into another size (through photocopying) because the graphical scale line and map size change in same dimension
Introduction to Maps – Large and Small Scale Maps • Two types of maps based on map scale are:- Small-Scale Maps- Large-Scale Maps • Small-scale maps show large portions of the earthcramped into a small paper • It is indicated by a map scale with a large denominator (1/1,000,000) • Examples of small-scale maps: World map, US Map
Introduction to Maps – Large and Small Scale Maps • Large-scale maps show a very small area of the earth in a large space • It is indicated by a map scale with a small denominator (1/100) • Examples of large-scale maps: - a house plan - a school map
Different Scales: From Small To Large Scale Maps Small Scale Large Scale Map
Introduction to Maps – Large and Small Scale Maps • Class Practice Exercises: • convert a statement scale (1inch = 2400 feet) to: - a fractional scale - a graphical scale • List three maps you consider to be a large-scale map
Introduction to Maps: Marginal Information on Maps • Maps are drawn for different purposes:- general purpose maps (e.g. world map)- thematic maps showing distribution of a specific phenomenon (population density) - In general, maps contain useful information to help in map interpretation- Most of such useful information are often shown on the margins of the map
Introduction to Maps: Marginal Information on Maps • Maps are drawn for different purposes:- general purpose maps (e.g. world map)- thematic maps showing distribution of a specific phenomenon (population density) • In general, maps contain useful information to facilitate their use and interpretation • Most of such useful information are often shown on the margins of the map
Introduction to Maps: Marginal Information on Maps • Some of these marginal information include:- Map title- Dates - Legend - Direction - Scale - Location - Data Source - Map projection, etc
Introduction to Maps: Marginal Information on Maps • Map Title:- It usually should reflect map content or purpose and identifies the area covered (e.g. Road Map of St. Louis) • Date:- Date of data collection and publication gives clear indication of how current or out-of- date the information on the map is
Introduction to Maps: Marginal Information on Maps • Legend:- Often shown as a box explaining symbols used on the map- Symbols, colors, shadings used in representing features on the map explained • Direction:- Directions are indicated using geographic grids (e.g. latitude and longitude) and north pointing arrow
Introduction to Maps: Marginal Information on Maps • Direction:- The north arrow points at the Geographic (True) North Pole - The Magnetic North Pole is the direction a magnetic compass points • Location:- Longitude and latitude coordinates are useful for locating places on maps
Introduction to Maps: Marginal Information on Maps • Map Scale:- Gives the relationship between length measures on the map and the corresponding distance on the ground- Map scale helpful when measuring distances between points or calculating the area occupied by any geographic feature on map
Introduction to Maps: Marginal Information on Maps • Data Source:- Information on data source is important in establishing credibility of the final map - It indicates the level of data quality and accuracy
Introduction to Maps: Map Projection • The Earth is spherical in shape as represented by the globe
Introduction to Maps: Map Projection • The globe accurately represents the shape of our planet • It is useful in maintaining the geometric relationships of:- longitudes to latitudes- equator to the poles- continents to oceans • It can also maintain correct:- comparative distances
Introduction to Maps: Map Projection • Without distortion, the globe can also maintain correct: - comparative sizes and- directions • But the globe has its own problems:- only half of the globe can be viewed at a time- only very little details can be displayed on a globe
Introduction to Maps: Map Projection • But the globe has its own problems:- globes are cumbersome to use and difficult to handle or carry around- computations on globe surfaces require complex and difficult equipment and techniques- globe construction is labor-intensive and costly
Introduction to Maps: Map Projection • In order to overcome some of the problems of working with the globe, flat maps are preferred because:- flat maps are portable- less expensive to reproduce- easy to work with • But this comes with some costs and disadvantages that include:- it may lead to geometric distortions
Introduction to Maps: Map Projection • But this comes with some costs and disadvantages that include:- violation of the continuity of the earth surface- distortion of reality - no true solutions to these problems hence all maps are not perfect
Introduction to Maps: Map Projection • Maps are flat whereas the Earth is spherical in shape • To produce a map, we need to transfer location information on spherical earth surface to their appropriate locations on a flat map
Introduction to Maps: Map Projection • The map projection process results in the distortion of four attributes of places on the globe:- distance between points- place orientation or direction- actual shape - actual size (i.e. area)
Introduction to Maps: Map Projection • The distortion problem progressively increases with the size of the globe being represented on a flat map • Common methods of map projections involves deliberate effort to preserve: - Conformal Projection (shape & direction preservation)- Equal-area or Equivalent Projection (size or area preservation)
Preserves Area or Size Preserves Shapes
Map Projection - conformal projection • It distorts size but preserves shape (or orientation) • Angular relationships are maintained such that shape of any geographic feature is the same as observed on the spherical earth • Meridians and parallels cross at right angles
Map Projection - conformal projection Continued • Sizes of geographical features become progressively larger towards the higher latitudes (hence Greenland appears bigger than necessary) • A good example is the Mercator projection (directions remain constant and rectangular shape fits a flat map model