Download
1 / 41
410 likes | 431 Views
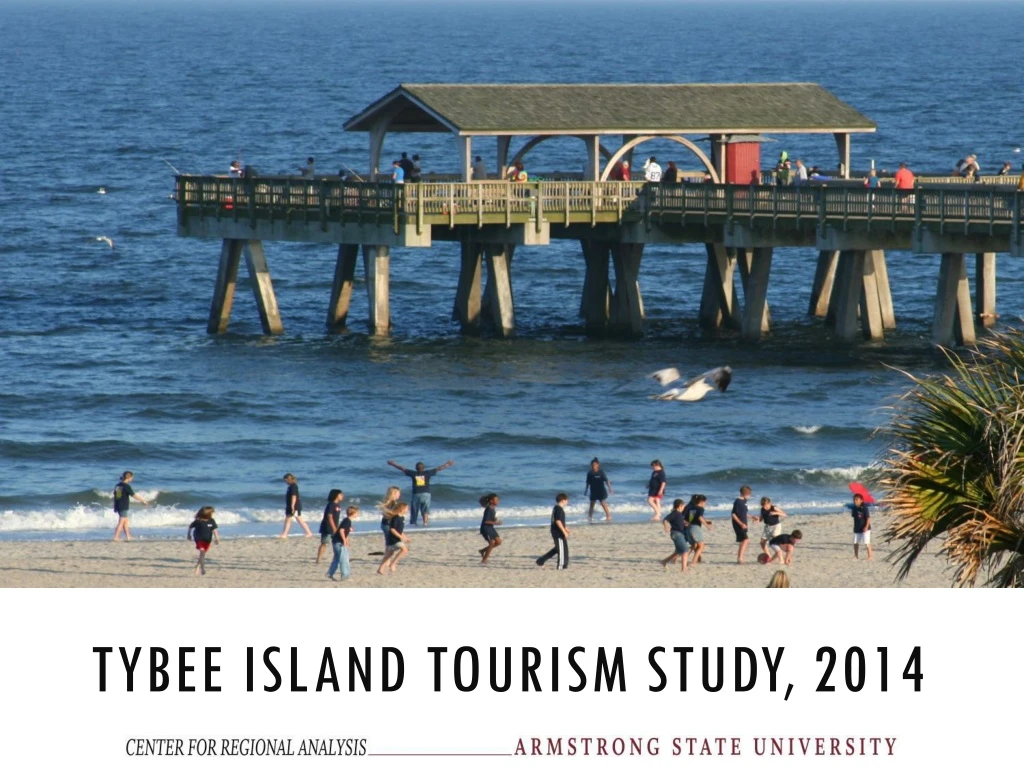
Explore the tourism economy on Tybee Island, GA through visitor surveys, expenditure patterns, economic and fiscal impact analyses, beach re-nourishment findings, and conclusions. Detailed data on annual visitation, room-night demand, and revenue distribution.

E N D
Outline • Introduction • Survey of Tybee Island Visitors • Visitor Expenditure Patterns • Estimated Annual Visitation and Room-Nights • Economic Impact Analysis • Fiscal Impact Analysis • Findings Related to Beach Re-nourishment Studies • Conclusion
1. Introduction • Examine aspects of the tourism economy on Tybee Island, Georgia. • Estimate total number of annual visitors and room-night demand. • Estimate Employment and Business Revenue economic impacts. • On-island and off-island • Estimate fiscal impacts on Tybee Island, the City of Savannah, and Chatham County. • Findings related to beach re-nourishment are presented.
Survey: BASICS • Walk-up survey: 1278 interviews (+/- 2.7%, with 95% confidence) • Oct, Nov in 2013 • March, May, June, July, Sep in 2014 • Locations: Lighthouse, 2nd St & south, Pier • Demographics, socio-economic, and point of origin • Analyze visitor expenditure patterns • Comparison across various subgroups • Chatham County • Georgia • Out-of-state • Travel with or without children
Visitors: Stay & Point of origin 63% day-trip 37% overnight trip
Point of origin: 3 digit zip code Darker regions indicate higher concentrations (%) of Tybee Island visitors.
Travel method to tybee and Previous visits 22% of visitors from >30 miles away had previously visited for 4.5 days. 24% of visitors from <30 miles away had previously visited for 3.6 days.
Travel party characteristicsParty size and children Average party size for all respondents was 3.6 people and 40.1% reported traveling with children
Overnight accommodations 37% of visitors had overnight accommodations. 62% of paid accommodations were on Tybee Island.
Room nights by party composition The number of room nights for all visitors was 4.7
Length of stay on the beach Most visitors tended to stay on the beach from 3 to 5 hours.
Cost of accommodations Avg. cost for all overnight visitors was $161.09 per night
Expenditure patterns: by point of origin Daily Avg. Expenditure by all was $65.92
Expenditure patterns by children present Spending per person/day traveling with children: $27.70 Spending per person/day traveling without children: $94.01
Annual visitors & room-night demand • Method to estimate based on: • survey expenditure data • confidential industry spend data • gross room sales (tax receipt data) • Annual visitation: 1,044,000 • Annual room-night demand: 247,500. • 52% Vacation Rental & 48% Hotel • FY14 Hotel/Motel Tax Revenue: $2.3 million • 62% Vacation Rental & 38% Hotel
property taxES • The effect on real property tax millage rates is computed under the assumption that in the absence of the tax revenue generated by Tybee Island Tourism, municipalities would simply raise the millage rate to offset the absence of such revenue. • About $50 per $230,000 house.
Budget analysis • One means of assessing the fiscal impact of tourism on Tybee Island is to compare the sources of revenue and expenditure for non-coastal cities in Georgia, that share similar economic and demographic characteristics with Tybee Island, but do not have a thriving tourism sector comparable to that of Tybee Island. • The resulting differences in expenditures can then be attributed to the presence of tourism on Tybee Island. • The cities that were found to be similar to Tybee, within Georgia, are Springfield, Jasper, Cleveland, Royston, Lavonia, Hahira, Statham, and Gray.
Consequences of Beach EROSION • If there were no Tybee beach, 92.5% fewer visitors would come to the Island. • Lost tax revenue: • City of Savannah: $2.1 million • Chatham County: $672,000 • not including Tybee lodging tax revenue for Trade Center. • Assuming property taxes would be raised to offset this loss of revenue, • City of Savannah: increase to 39.95 mills from 39.299 mills • Chatham County: increase to 30.73 mills from 30.389 mills • City of Tybee Island tourism-related revenue (sales taxes, hotel/motel taxes, parking revenue) falls about $4.5 million.
8. Conclusion Tourism on Tybee Island heavily shapes economic activity on the island. • 1,044,000 annual visitors from 37 states and overseas • Nearly 250,000 room-nights • 82% of workers in Tybee establishment workers supported by tourism (1,225 jobs). • Tybee Island businesses earn $93 million in revenue. • $81 million spent in Chatham County (off-island) and the City of Savannah where another 1,643 workers have jobs primarily in retail trade, lodging, and restaurants. • Combined, local governments derive about $8.7 million in tax revenue from Tybee-related tourism. • Property tax relief of about $50 per $230,000 house.