Download
1 / 53
530 likes | 548 Views
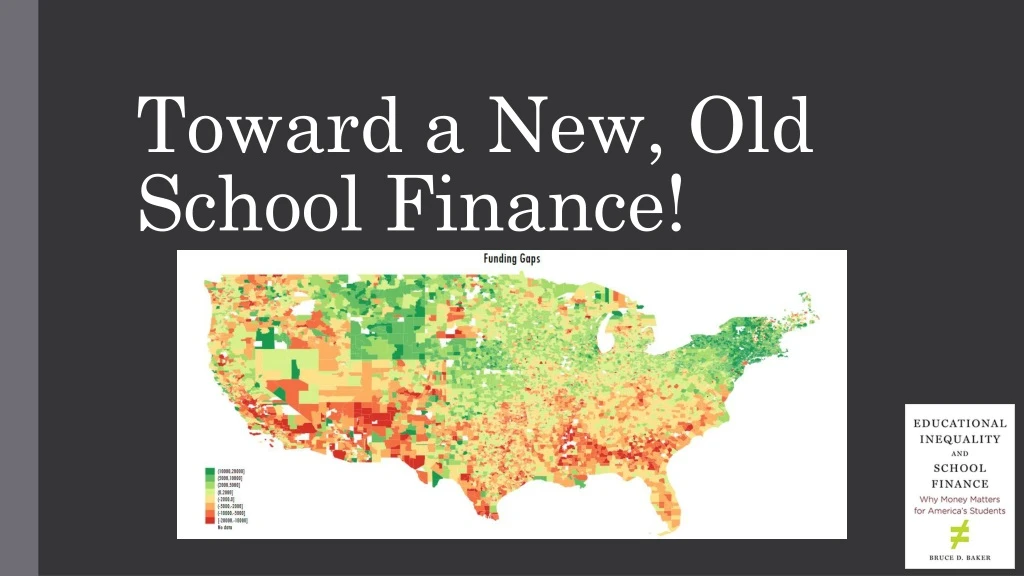
Toward a New, Old School Finance!. Themes. Money matters! Money translates primarily to human resources Trade-off between quantity and wage There are no magical substitutes Tech-based solutions? Pubic district, charter and private schools allocate resources largely the same!

E N D
Themes • Money matters! • Money translates primarily to human resources • Trade-off between quantity and wage • There are no magical substitutes • Tech-based solutions? • Pubic district, charter and private schools allocate resources largely the same! • Running multiple systems in a common space induces inefficiency • School spending has not grown out of control for decades! • During bad times, school spending stagnates or even declines • But during good times, at least in recent cycles, spending doesn’t rebound • School spending varies substantially across states! • For a variety of reasons • Some states have really thrown public schooling under the bus
Money matters myths! • Clouds of doubt • Weak correlation between spending and outcomes? • More thorough statistical analysis finds otherwise! • The Long Term Trend • Spending has doubled and performance is flat? • But a) spending hasn’t doubled and b) performance isn’t flat! • AND, more thorough statistical analysis finds otherwise! • International Comparisons • We spend more than any other nation (in the world, ever!) and get little, by comparison, in return? • Just no! • Spending figures most frequently cited simply not comparable (do not cover comparable range of costs/services) • Numerous other relevant factors invariably left out of comparisons. • How money is spent matters more than how much? • But, if you don’t have it, you can’t spend it! • (assumes flexibility in trade-offs between staffing quality/quantity) • LAUSD Class Size / Teacher Wage problem
Clouds of Doubt! BS BS BS BS BS BS BS BS BS Test Scores BS BS BS BS BS BS BS Money 2-Dimensional Social Science?
The “Long Term Trend” The specious claim that school spending has risen dramatically over time coinciding with virtually no change in student outcomes
https://www.educationnext.org/could-disappointing-2017-naep-scores-due-to-great-recession/https://www.educationnext.org/could-disappointing-2017-naep-scores-due-to-great-recession/
International Comparisons? https://t.co/p4dgJR48zC
Low Wage/Large Class High Wage/Large Class High Wage/Small Class Low Wage/Small Class OECD (2014), Education at a Glance 2014: OECD Indicators, OECD Publishing. http://dx.doi.org/10.1787/eag-2014-en Table D2.1. Average class size, by type of institution and level of education (2012) & Table D3.2. Teachers' salaries relative to earnings for full-time, full-year workers with tertiary education (2012)
Low Wage/Large Class High Wage/Large Class High Wage/Small Class Low Wage/Small Class OECD (2014), Education at a Glance 2014: OECD Indicators, OECD Publishing. http://dx.doi.org/10.1787/eag-2014-en Table D2.1. Average class size, by type of institution and level of education (2012) & Table D3.2. Teachers' salaries relative to earnings for full-time, full-year workers with tertiary education (2012)
Recession Recovery? Recession (but housing/ property values continue to grow) Tech Boom Recession Sources: Current Population Survey: Income, US Census Bureau, http://www.census.gov/hhes/www/income/data/historical/families/; Population Estimates, US Census Bureau, http://www.census.gov/popest/data/historical/2010s/vintage_2013/national.html and http://www.census.gov/popest/data/national/asrh/2014/index.html; State and Local Government Finances, US Census Bureau, http://www.census.gov/govs/local/; National Income and Product Accounts Tables, Bureau of Economic Analysis, US Department of Commerce, http://www.bea.gov/iTable/index_nipa.cfm.
Recovery? Recession Recession (but housing/ property values continue to grow) Tech Boom Source: Baker et al., School Funding Fairness Data System.
Recession (but housing/ property values continue to grow) Recovery? Recession Tech Boom Notes: "College graduates" excludes public school teachers, and "all workers" includes everyone (including public school teachers and college graduates). Wages are adjusted to 2015 dollars using the CPI-U-RS. Data are for workers aged 18–64 with positive wages (excluding self-employed workers). Nonimputed data are not available for 1994 and 1995; data points for these years have been extrapolated and are represented by dotted lines (see Appendix A for more detail).
Tech Boom Recovery? Recession Recession (but housing/ property values continue to grow) Sources: State and Local Government Finance Data Query System, The Urban Institute–Brookings Institution Tax Policy Center, http://www.taxpolicycenter.org/slf-dqs/pages.cfm; US Census Bureau, Annual Survey of State and Local Government Finances, Government Finances, Vol. 4, and Census of Governments (1990–2014)
Note: *Per-pupil revenue projected for districts with more than 2,000 pupils, average population density, average labor costs, and 20% of children in poverty. Source: Baker et al., School Funding Fairness Data System
Note: *Per-pupil revenue projected for districts with more than 2,000 pupils, average population density, average labor costs, and 20% of children in poverty.
Notes: *Current spending per pupil projected for districts with more than 2,000 pupils, average population density, average labor costs, and 20% of children in poverty. **Teachers per 100 pupils projected for districts with more than 2,000 pupils, average population density, average labor costs, and 20% of children in poverty. Source: Baker et al., School Funding Fairness Data System
Notes: *Teacher wage as % of non-teacher wage at same age, degree level, hours per week & weeks per year Source: Baker et al., School Funding Fairness Data System
Student Population Input Prices Structural/ Geographic Constraints Measured Student Outcomes Cost Spending Inefficiency Efficiency Controls: Fiscal capacity, competition, & public monitoring
Current Average Resources Adequacy Target Exceeds Current Average Actual Distribution Current Average Outcomes Outcomes Equal Opportunity Intercept Adequacy Cost Exceeds Current Average Resources
Current spending (2013-2015) as % of “cost” of achieving national average outcomes (red = lower, green = higher) Current outcomes (2013-2015) with respect to national average outcomes (red = lower, blue = higher)
Source: Data from Baker et al., The Real Shame of the Nation
Large Districts >75k 1 . 5 Jefferson County School District No. R-1 Wake County Schools Montgomery County Public Schools Anne Arundel County Public Schools 0 . Gwinnett County Cobb County Fulton County Baltimore County Public Schools Fairfax Co Pblc Schs Charlotte-Mecklenburg Schools Palm Beach Broward Lee Orange Dade Cypress-Fairbanks Isd Hillsborough 0 Duval Pinellas New York City Public Schools Prince Wm Co Pblc Schs Northside Isd Polk Clark County School District Austin Isd Jefferson County School District No. 1 In The County Of Denver And State Of C City Of Chicago Sd 299 Prince George'S County Public Schools Albuquerque Public Schools San Diego Unified Davidson County Sd 5 0 Dekalb County . Houston Isd - Long Beach Unified Philadelphia City Sd Dallas Isd Baltimore City Public Schools Fort Worth Isd Los Angeles Unified 1 . Milwaukee School District - 0 .5 1 1.5 2 Current Spending as % of Cost of Avg. Outcomes Gap between Current Outcomes & National Mean Fitted values


