Download
1 / 1
10 likes | 127 Views
pH Levels in Tumwater and Valley Creeks. Lauryn Last, North Olympic Peninsula Skills Center Natural Resources. Prior Knowledge

E N D
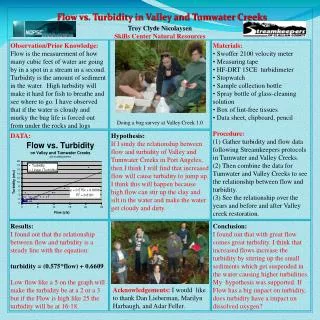
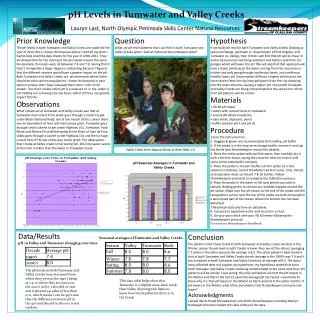
pH Levels in Tumwater and Valley Creeks Lauryn Last, North Olympic Peninsula Skills Center Natural Resources Prior Knowledge The pH levels in both Tumwater and Valley Creeks are stable for the year of 2010-2011. I know this because before I started my work I had to look at all the data sheets for the year of 2010-2011. They all showed that for the most part the pH stayed around the same. For example, the levels were all between 7.4 and 7.9. Seeing that it hasn’t changed by a larger degree is interesting because I figured that the different seasons would have a greater impact on the pH. Both Tumwater and Valley Creeks are environments where there should be coho salmon populations. I know this because in past salmon surveys that I have reviewed there were coho in the stream. Too much acidity which pH is a measure of in the water is not healthy nor is having it be too basic, either of these can greatly impact fish life. Observations What I observed at Tumwater and Valley Creeks was that at Tumwater river mile 4.4 the water goes through a culvert to get under Black Diamond Road, and at the mouth of this culvert there was an abundance of mint and reed canary grass. Tumwatergoes through small culverts to get under Highway 101, Tumwater Truck Route and Marine Drive before going to the Strait of Juan de Fuca. Valley goes through a culvert under Highway 101 and then a huge culvert from 6th Street all the way to the Strait. The observation that I made at Valley Creek is that during fall, 2011 the water seems to be much murkier than the water in Tumwater Creek. Question What are pH level patterns that I can find in both Tumwater and Valley Creeks when I look at historical StreamKeepers data? • Hypothesis • If we study pH level in both Tumwater and Valley Creeks (looking at seasonal change, upstream vs. downstream of Port Angeles, and Tumwater vs. Valley), then I think I will find that pH will be lower in winter because rain will bring sediment and battery acid from car garages which will lower the pH. We will also find that upstream will have a lower pH because the water coming from the mountains is fresher and only going through coniferous forest, and coniferous needles lower pH. Downstream will have a higher pH because the storm drains from the city have pollutants from the city dumping into the lower streams, causing a higher pH. Since both Tumwater and Valley Creeks are being contaminated at the same time I thinktheir pH patterns will be similar. • Materials • • YSI 60 pH meter • • watch with second hand or stopwatch • • 6 extra AA alkaline batteries • • data sheet, clipboard, pencil • buffer solution pH 7 and pH 10 • Procedure • 1.Turn the instrument on. • 2. Goggles & gloves are recommended for handling pH buffer . • 3. If the probe is in the long-term storage bottle, remove it and cap the bottle (see Streamkeepers manual for details). • 4. Rinse the entire probe with purified water, then carefully dry it with a lint-free tissue, saving the tissue for later (or rinse it with some of the extra buffer solution). • 5. Place the probe in the pH 7 buffer. Let the probe sit in this solution to stabilize, record the Meter’s kit # or name, time, initials, and expiration dates on the pH 7 & 10 bottles. Follow Streamkeepers protocols to complete the calibration process. • 6. Place the probe in the water at the spot where you wish to sample, shaking gently to remove any bubbles trapped around the pH sensor. Make sure the pH sensor at the end of the probe and the temperature sensor near the top of the probe are both immersed in a well-mixed part of the stream where the bottom has not been disturbed. • 7.Record pH data and time on datasheet. • 8. Compare to expected results and record on a chart. • 9. Do your post check with your YSI 60 meter following the Streamkeeper protocol. • For more see Streamkeepers Handbook. Valley Creek Semi-Natural Reach at River Mile 1.0 Data/Results pH in Valley and Tumwater changing over time Conclusion The patterns that I have found in both Tumwater and Valley creeks are that in the Winter season the pH level in both Creeks is lower then any of the others, averaging 7.7 when in the other seasons the average is 8.0. The other pattern I have found is that in both Tumwater and Valley Creeks the pH average in the 1990’s was 7.4 and it has increased in both Tumwater and Valley Creeks to an average of 8.0. The data I have collected does not support my hypothesis, my hypothesis stated that since both Tumwater and Valley Creeks are being contaminated at the same time their pH patterns will be similar. I was wrong, the only similarities are that the pH lowers in the Winter and that in the last 22 years the average pH has raised. I would like to know why it is that pH lowers in the Winter so much and not in the other months. If pH lowers in the Winter, what other parameters that Streamkeepers measure also lower? Acknowledgments I would like to thank Mr.Lieberman and all the Streamkeepers including Marilyn Harbaugh who have helped the class collect all the data. Seasonal averages of Tumwater and Valley Creeks The pH levels in both Tumwater and Valley Creeks have increased from where they were in the 1990’s being at 7.4, to where they arenow is in the 2000’s at 8.0. I also did a t-test and it showed a p value of less than 0.01, which means I can be 99% sure that the difference between pH in the 90’s and the pH in the 00’s is not random. This data table helps show that Tumwater is a slightly more basic creek than Valley. Knowing this helps us know how much pollution there is in the Creek.