Data Analysis Techniques: Decision Trees, Clustering, and Association Rules in SAS
This guide explores essential data analysis techniques such as Decision Trees, Clustering, and Association Rules. Understand when to apply each analysis type, such as predicting student class performance or customer purchasing behavior. Learn how to utilize SAS for clustering website visitors based on behavior, and discover the significance of splitting statistics like Gini Coefficient and Chi-Square in Decision Trees. Additionally, the guide delves into the implications of cluster analysis, including cohesion, distinctiveness, and the impact of outliers.

Data Analysis Techniques: Decision Trees, Clustering, and Association Rules in SAS
E N D
Presentation Transcript
Exam 3 Sample Decision Trees Cluster Analysis Association Rules Data Visualization SAS
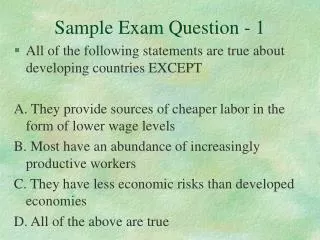
SAS • When to Use Which Analysis (D, C or A)? • When someone gets an A in this class, what other classes do they get an A in? • What predicts whether a company will go bankrupt? • If someone upgrades to an iPhone, do they also buy a new case? • Which party will win the election? • Can we group our website visitors into types based on their online behaviors? • Which customers will purchase our product? • Can we identify different product markets based on customer demographics?
SAS • When to Use Which Analysis (D, C or A)? • When someone gets an A in this class, what other classes do they get an A in? • What predicts whether a company will go bankrupt? • If someone upgrades to an iPhone, do they also buy a new case? • Which party will win the election? • Can we group our website visitors into types based on their online behaviors? • Which customers will purchase our product? • Can we identify different product markets based on customer demographics?
Decision Trees • Which is the Root Node? • # Leafs Nodes?
Decision Trees • Which is the Root Node? • # Leafs Nodes? 1 2 5 3 4
Probability of Purchase?i) Female, 130 lbs, 12 ft? ii) 120 lbs, 5 feet, male? • Best predictor variable? >=6’ <6’ Height <170 >=170 <150 >=150 Weight Weight Outcome Data 0 62%1 38%n 350 Outcome Data 0 40%1 60%n 150 Outcome Data 0 55%1 45%n 250 Outcome Data 0 60%1 40%n 250 Male Female Gender Outcome Data 0 45%1 55%n 75 Outcome Data 0 35%1 65%n 75
Probability of Purchase?i) Female, 130 lbs, 12 ft? ii) 120 lbs, 5 feet, male? • Best predictor variable? >=6’ <6’ Height <170 >=170 <150 >=150 Weight Weight Outcome Data 0 62%1 38%n 350 Outcome Data 0 40%1 60%n 150 Outcome Data 0 55%1 45%n 250 Outcome Data 0 60%1 40%n 250 Male Female Gender Outcome Data 0 45%1 55%n 75 Outcome Data 0 35%1 65%n 75
Probability of Purchase?i) 5 ft 5 inches? ii) 6 ft 5 inches 190 lbs? >=6’ <6’ Height <170 >=170 <150 >=150 Weight Weight Outcome Data 0 62%1 38%n 350 Outcome Data 0 40%1 60%n 150 Outcome Data 0 55%1 45%n 250 Outcome Data 0 60%1 40%n 250 Male Female Gender Outcome Data 0 45%1 55%n 75 Outcome Data 0 35%1 65%n 75
Decision Trees • What does it mean that Gender is only on the right side of the tree? Why is it not on both sides? • Based on the tree, which demographic is MOST likely to buy the product? Least likely to buy the product?
Decision Trees • What does it mean that Gender is only on the right side of the tree? Why is it not on both sides? • Gender only has predictive/explanatory power for customers who are greater than or equal to 6 feet and below 170lbs. • That is, in other subsets of the population, it does no better than chance at predicting behavior. • Based on the tree, which demographic is MOST likely to buy the product? Least likely to buy the product? • Biggest Leaf Node Probability (1): Over 6 ft, below 170 lbs, female (1 = 65% probability) • Biggest Leaf Node Null Probability (0): below 6 ft, below 150 lbs(0 = 62% probability)
Decision Trees • What Statistics are Used to Determine Splits for Decision Trees? • Gini Coefficient, Chi-Square Statistics (p-value) • What does it mean when the Gini = 1? • What does it mean when the Chi-square is bigger? • What happens to the p-value as the Chi-square gets bigger?
Decision Trees • What Statistics are Used to Determine Splits for Decision Trees? • Gini Coefficient, Chi-Square Statistics (p-value) • What does it mean when the Gini = 1? • The predictor is no better than flipping a coin (you want a small Gini) • What does it mean when the Chi-square is bigger? • The variable is better at predicting the outcome (you want a big Chi-square) • What happens to the p-value as the Chi-square gets bigger? • The p-value gets smaller as the Chi-square gets bigger (you want a small p-value)
Clustering • What statistics do we care about in cluster analysis? What do they represent? • What happens to these statistics as the number of clusters is increased? • Why do we standardize data? Why do we eliminate outliers?
Clustering • What statistic do we care about in cluster analysis? What does it represent? • Sum of Squared Errors – SSE (or Root Mean Square Std Dev.) • Within SSE = cohesion, Between SSE = distinctiveness • What happens to these statistics as the number of clusters is increased? • SEE goes down (both within and between) • More cohesive clusters, less distinct though • Why do we standardize data? Why do we eliminate outliers? • Standardize else variables with bigger values will have greater weighting • Elimination outliers because they can skew results
Clustering • What are the pros and cons of having only a few clusters (compared to having many clusters)? • What is bad about the below cluster analysis result? How would you improve it?
Clustering • What are the pros and cons of having only a few clusters (compared to having many clusters)? • Easier to interpret/analyze, but they may be less informative • What is bad about the below cluster analysis result? How would you improve it? • Clusters should be fairly round! • Add more clusters.
Association Rules • How would you describe the following association rule? • {Meat, Dairy} {Vegetables} • How many items are in this item set? • What is (are) the antecedents? What are the consequents? • What are the statistics we care about when evaluating an association rule?
Association Rules • How would you describe the following association rule? • {Meat, Dairy} {Vegetables} • When someone eats meat and dairy they also eat vegetables. • How many items are in this item set? • This is a 3 item set. • What is (are) the antecedents? What are the consequents? • Meat and Dairy are the antecedents, vegetables is the consequent. • What are the statistics we care about when evaluating an association rule? • Support count, Support Percent, Confidence and Lift
Association Rules • Do the following two rules have to have the same Confidence? The same Support? The same Lift? • {Meat, Dairy} {Vegetables} • {Vegetables} {Meat, Dairy} • What does Lift > 1 mean? Would you take action on such a rule? • What about Lift < 1? • What about Lift = 1?
Association Rules • Do the following two rules have to have the same Confidence (NO) ? The same Support (Yes)? The same Lift (Yes)? • {Meat, Dairy} {Vegetables} • {Vegetables} {Meat, Dairy} • What does Lift > 1 mean? Would you take action on such a rule? • More co-purchase observed than chance would predict (+ association) • What about Lift < 1? Less than chance predicts (- association) • What about Lift = 1? Chance explains the observed co-purchase (no apparent association)
Association Rules • What might you do as a manager if you saw a very high Lift and Confidence for the following rule about product purchase? Why would you do this? • {Pasta} {Orange Juice}
Association Rules • What might you do as a manager if you saw a very high Lift and Confidence for the following rule about product purchase? Why would you do this? • {Pasta} {Orange Juice} • Encourage pasta buyers to see OJ (placement) • Get them in and milk ‘em (discount pasta, premium OJ) • Target market (advertise new OJ to Pasta customers)
Association Rules • What is the most reliable association rule below?
Association Rules • What is the most reliable association rule below? • Rule 2 – Tied for best Lift (3.60), but has Better confidence!
Data Visualization • Look at In-Class Exercise Answers...