Download
1 / 13
130 likes | 252 Views
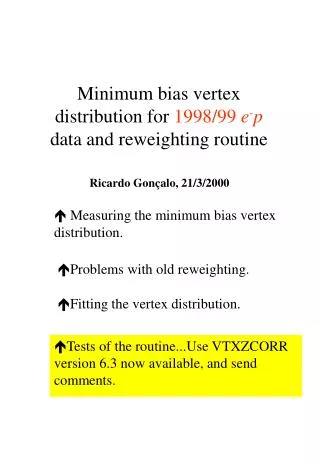
Minimum bias vertex distribution for 1998/99 e - p data and reweighting routine. Ricardo Gonçalo, 21/3/2000. Measuring the minimum bias vertex distribution. Problems with old reweighting. Fitting the vertex distribution.

E N D
Minimum bias vertex distribution for 1998/99 e-p data and reweighting routine Ricardo Gonçalo, 21/3/2000 Measuring the minimum bias vertex distribution. • Problems with old reweighting. • Fitting the vertex distribution. • Tests of the routine...Use VTXZCORR version 6.3 now available, and send comments.
Method to measure a Minimum Bias Vertex Distribution(A. Quadt & O. Ruske, ZN 98-36) Y • Divide the CTD into three overlapping regions. • Apply cuts to Neutral Current events in these regions. Cuts are based on geometry of CTD/CAL to have constant efficiency in each region. • Measure e with CAL hit and optimum h with CTD. reg. 1 reg. 2 reg. 3 Z Vertex reweighting for 98/99 e- data
Problems with old reweighting: Problem in normalization of regions Bias in regions 1 and 3 (RCAL/FCAL) Bias in Wodarczyk’s method for Z > 50 cm Q2 range in MC sample Vertex reweighting for 98/99 e- data
Changes to old method BCAL R3 R2 R1 CTD 25 cm SL6 SL8 RCAL solenoid In reg. 2 and 3 e had to be raised to match MC Q2 range + in reg. 3 e>2.69 to eliminate bias (dead material?) h was raised to have more stereo hits in optimum hadronic tracks Regions normalised with 1/Eff; Eff calculated using flat vertex MC Vertex reweighting for 98/99 e- data
Independent minimum bias method used for tests(M. Wodarzcyk) • Guarantee that there are always good tracks: either electron or hadrons. Problem: Not using electron seed vertex low efficiency for Z > 50 cm (hadronic tracks) q Z>50 cm g Vertex reweighting for 98/99 e- data
Efficiency determination with flat vertex MC Still some bias in region 1 ? Good enough to get vertex distribution More flat vertex Monte Carlo on the way Vertex reweighting for 98/99 e- data
Fit to data vertex distribution Fitted 5 gaussians to 98/99 data min. bias vertex distribution Satellite pairs is constrained but not distance from main peak 2/ndf = 88.7/73 …not bad ! 98 MC vertex Neglected Z<-88cm and Z>82cm in fit but points still used to get reweighting factors Function fitted to data Shapes of 98 MC generated vertex and 98/99 data min. bias vertex Vertex reweighting for 98/99 e- data
Comparison with Wodarczyk’s method Good agreement (except for Z < -85 cm). For Z>50 cm Wodarczyk’s points should not be taken into account. For -50<Z<-40 two methods are now within 2 or better. Vertex reweighting for 98/99 e- data
Reweighting routine VtxZCorr version 6.3 • Can be used to reweight distributions found in 1998/99 Monte Carlo generated with 1997 vertex distribution. VtxZCorr63(zvertex,toyear,weight,errcode) Input: zvertex Z coordinate of “true” vertex of the generated event. toyear year of data taking to which the MC is being reweighted (1998, 1999 or 9899). Output: weight statistical weight of the event in the distributions. errcode 0 means OK, 1 means Error. Vertex reweighting for 98/99 e- data
Chris test of the reweighting with SFEW cuts Reweighted MC 98/99 data Essentially OK, but MC overshoots data for Z<-60 cm and Z>70 cm Vertex reweighting for 98/99 e- data
Comparison of reweighted/unreweighted MC to 98/99 data in bins of Z - Q2DA Vertex reweighting for 98/99 e- data
Comparison of reweighted/unreweighted MC to 98/99 data in bins of Z - e Points at high e low Q2 lower Q2 MC needed? Test best done with MC generated with new distribution Vertex reweighting for 98/99 e- data
Fits to X and Y minimum bias vertex distributions • X and Y vertex obtained from same selection as Z vertex. • Normalization between regions as for the Z vertex X vertex: mean = -0.0243 0.0005 cm = 0.1192 0.0005 cm Y vertex: mean = 0.0448 0.0004 cm = 0.0899 0.0003 cm Vertex reweighting for 98/99 e- data