Download
1 / 61
610 likes | 738 Views
Mass spectrometry. Chapter 9 p. 167. Mass spectrometer. Introduction. Principles:

E N D
Mass spectrometry Chapter 9 p. 167
Introduction • Principles: • A mass spectrometer works by generating charged molecules or molecular fragments either in a high vacuum or immediately prior to the sample entering the high vacuum region. The ionised molecules have to be generated in the gas phase. • In classical mass spectrometry there was only one method of producing the charged molecules, but now there are quite a number of alternatives. • Once the molecules are charged and in the gas phase, they can be manipulated by the application of either electric or magnetic fields to enable the determination of their molecular weight and the molecular weight of any fragments which are produced by the molecule breaking up.
Introduction Applications of MS: 1) Determining or confirming the identity or structure of drugs and raw materials used in their manufacture. 2) MS coupled with either gas chromatography (GC-MS) or liquid chromatography (LC-MS) provides a method for characterising impurities in drugs and formulation excipients. 3)GC-MS and LC-MS provide highly sensitive and specific methods for determining drugs and their metabolites in biological fluids and tissues.
Introduction Limitations: 1) Mass spectrometry is not currently used in routine quality control (QC) but is placed in a research and development (R & D) environment where it is used to solve specific problems arising from routine processes or in process development 2) The instrumentation is expensive and requires support by highly trained personnel and regular maintenance. However, these limitations are gradually being removed.
Instrumentation A schematic view of a magnetic mass spectrometer is shown in next figure . • The sample is introduced into the instrument source by heating it on the end of a probe until it evaporates, assisted by the high vacuum within the instrument. • Once in the vapor phase, the analyte is bombarded with the electrons produced by a rhenium or tungsten filament, which are accelerated towards a positive target with an energy of 70 e V. The analyte is introduced between the filament and the target, and the electrons cause ionisation as follows: M + e → M+ • Since the electrons used are of much higher energy than the strength of the bonds within the analyte (4-7 e V), extensive fragmentation of the analyte usually occurs. Two types of systems are commonly used to separate ions on the basis of their charge to mass ratio (m/z).
I-Magnetic sector instruments • In a magnetic sector instrument, • the ions generated are pushed out of the source by a repeller potential of same charge as the ion itself, and • are then accelerated in an electric field of ca 3-8 kV and travel through an electrostatic field region so that they are forced to fall into a narrow range of kinetic energies prior to entering the field of a circular magnet. • They then adopt a flight path through the magnetic field depending on their charge to mass (m/z) ratio; the large ions are deflected less by the magnetic field: Where H is the magnetic field strength r is the radius of the circular path in which the ion travels and V = the accelerating voltage.
II-Quadrupole instruments • It is based on the quadrupole analyser shown on next figure, which uses two electric fields applied at right angles to each other, rather than a magnetic field, to separate ions according to their m/z ratios. One of the fields used is DC and the other oscillates at radiofrequency. • The effect of applying the two electrostatic fields at right angles to each other, one of which is oscillating, is to create a resonance frequency for each mlz value; ions which resonate at the frequency of the quadrupole are able to pass through it and be detected. Thus ions across the mass range of the mass spectrum are selected as the resonance frequency of the quadrupole is varied.
II-Quadrupole instruments • A quadrupole instrument is more sensitive than a magnetic sector instrument since it is able to collect ions with a wider range of kinetic energies. • The disadvantage of a simple quadrupole mass spectrometer is that it cannot resolve ions to an extent> 0.1 amu whereas a magnetic sector instrument can resolve ions to a level of 0.000 1 amu or more. This enables the latter to be used to determine accurate masses for unknown compounds and thus assign their elemental compositions.
Mass spectra obtained under electron impact (EI) ionisation conditions • The original type of ionisation employed in mass spectrometry was electron impact (EI) ionisation. • This type of ionisation uses high energy electrons which produce extensive fragmentation of the bonds within the analyte. It is still very commonly used in standard chemical analyses • But it is not applicable in case of molecules that are very non-volatile or unstable. In such cases there are other ionisation techniques can be applied. These other ionisation techniques, are often used in conjunction with chromatography such as GC-MS and LC-MS. Alternatively , they may also be applied without prior chromatographic separation having been carried out.
The previous figure shows a generalised scheme for decomposition of a molecule under EI conditions. The principles of the scheme are as follows: • M•+ represents the molecular ion which bears one positive charge since it has lost one electron and the unpaired electron which results from the loss of one electron is represented by a dot. • M•+ may lose a radical which, in a straightforward fragmentation not involving rearrangement, can be produced by the breaking of any single bond in the molecule. The radical R • removes the unpaired electron from the molecule leaving behind a cation A + • This cation can lose any number of neutral fragments (N) such as H2O or CO2 but no further radicals.
The same process can occur in a different order with a neutral fragment (H2O, CO2, etc.) being lost to produce B •+ and since this ion still has an unpaired electron it can lose a radical to produce C+ ; this ion can thereafter only lose neutral fragments. • To summarise, the following rules apply to mass spectrometric fragmentation: • The molecular ion can lose only one radical but any number of neutral fragments. • Once a radical has been lost only neutral fragments can be lost thereafter.
Molecular fragmentation patternsHomolytic and heterolytic α-cleavage • Under El conditions, the analyte develops a positive charge through the loss of one electron. • If there is an electronegative atom in the structure of the molecule such as N or O, this positive charge will be on the electronegative atom(s). But if an electronegative atom is absent, the charge is more difficult to locate with certainty. • Next figure shows the EI spectrum of ethanol which provides an example of two types of fragmentation.
Molecular fragmentation patternsHomolytic and heterolytic α-cleavage The process is as follows: • Homolyticα-cleavage (Fig. 9.5) is promoted by the presence of a hetero atom such as oxygen, nitrogen or sulphur and in molecules containing a hetero atom it often gives rise to the most abundant ion in the mass spectrum (the base peak). • One electron in the bond broken goes to the radical and the other combines with the unpaired electron on the hetero atom to produce a double bond; the hetero atom becomes positively charged. • Loss of the largest possible radical is most favoured. In the case of ethanol, loss of CH3- gives rise to the base peak in the mass spectrum at mlz31.
For many drug molecules this type of fragmentation dominates their mass spectra. A minor ion in the spectrum of ethanol results from heterolytic α -cleavage (Fig. 9.6). • As is illustrated in Figure 9.7, homolytic α -cleavage is the major fragmentation mechanism for chains containing hetero atoms.
Cleavage with proton transfer • Cleavage with proton transfer is also common in the mass spectra of drug molecules. • In the first two examples, the initial step is homolytic α-cleavage as shown in Figure 9.11; this is followed by loss of a neutral hydrocarbon fragment. • Table 9.1 shows some typical small fragments which are lost from the molecular ions of molecules.
Fig. 9.11 : Some examples of cleavage involving intramolecular proton transfer.
EI mass spectra of some drug moleculesExamples where the molecular ion is abundant • In some drugs, the molecular ion may be abundant in the mass spectrum. • Figure 9.15 shows the mass spectrum of codeine, where the molecular ion at mlz299 is the base peak. The extended ring structure of the molecule means that apart from the abundant molecular ion, the fragmentation of codeine is not easy to interpret because of the structural rearrangements which occur. The only other ion in the mass spectrum of codeine closely related to the molecular ion is at mlz229 and formation of this ion involves some rearrangement of the ring structure.
Drugs which yield abundant molecular ions under EI conditions include: caffeine, coumatetralyl, cyclazocine, dextromethorphan, dichlorphenamide, diflunasil, dimoxyline, fenclofenac, flurbiprofen, griseofulvin, harmine, hydralazine, hydroflumethiazide, ibogaine, ketotifen, levallorphan, methaqualone, nalorphine. • These drugs are characterised by having ring structures without extensive side chains, or if side chains are present, they do not contain hetero atoms which would direct cleavage to that part of the molecule.
Drug molecules in which homolytic α-cleavage dominates the spectrum • Since many drugs contain hetero atoms the fragmentation of drug molecules is often directed by α-homolytic cleavage adjacent to these atoms. • Figure 9.16 shows the mass spectrum of bupivacaine, where α-homolytic cleavage is directed by the nitrogen atom in the heterocyclic ring resulting in an ion at mlz140, which dominates the spectrum. • A similar type of fragmentation dominates the spectrum of other local anaesthetics such as prilocaine and procaine; and sympathomimetics such as ephedrine, salbutamol and terbutaline and p-adrenergic blockers such as propranolol and oxyprenolol.
Isotope peaks • Figure 9.17 A shows the mass spectrum of chloroquine under EI conditions. This molecule gives a spectrum typical of a basic compound with a side chain. In this case homolytic a-cleavage takes place adjacent to the nitrogen in the side chain with the charge being retained on the smaller portion of the molecule resulting in an ion at mlz 86. • Another note is the double molecular ion which occurs at mlz 319 and mlz 321, and which arises from the presence of a chlorine atom in the molecule. • Chlorine has two common isotopes with atomic masses 35 and 37 in the ratio 3: 1, and the small molecular ion for chloroquine at mlz 319 has a peak associated with it in a 3: 1 ratio at mlz 321. This is seen more clearly in the negative ion chemical ionisation (NICI) spectrum of chloroquine (Fig. 9.17B).
Fig. 9.17: • The EI mass spectrum of chloroquine. • The NICI mass spectrum of chloroquine.
NICI is a soft ionisation technique which produces little, if any, fragmentation in a molecule and results in an abundant molecular ion. • In this case, the chlorine isotope peak for chloroquine at mlz321 can be seen clearly, Bromine in the structure of a molecule will also produce an isotope pattern since it has isotopes with atomic weights of 79 and 81 which occur in more or less a 1:1 ratio. • These typical patterns can be useful in characterisation of impurities in synthetic drugs because reactive intermediates which are used in drug synthesis may contain bromine or chlorine. If more than one chlorine or bromine atom is present, then the isotope pattern is more complex.
The isotopes of all the other elements commonly found in drug molecules are much less abundant, although because of the number of carbon atoms in large molecules, the M+ 1 ion for carbon is usually substantial. • Although the abundance of carbon-13 is only 1.1 % compared with carbon-12, the presence of 40 carbon atoms in a molecule would give rise to an M+ 1 ion with a 44% abundance since there is a 44% probability that the molecule will contain a carbon-13 atom.
Tropylium ion • Another type of directed fragmentation occurs in molecules which have a benzyl group. For instance, the spectrum of levodopa (L-dopa) is dominated by an ion at mlz123 which arises from the formation of a tropylium ion as shown in Figure 9.18. This ion is readily formed in any compound with a benzyl group. The benzyl CH2 becomes incorporated into a seven-membered ring structure in which the positive charge on the ion is delocalised around the ring structure, giving a very stable cation. Of course other types of fragmentation can compete; in the case of L-dopa, homolytic cleavage next to the nitrogen atom is possible which gives rise to a fragment at • mlz74, but this fragment is of lower abundance than the fragment at mlz123.
Fig. 9.18 : Two routes of fragmentation in the mass spectrum of L-dopa.
Gas chromatography-mass spectrometry (GC-MS) • Gas chromatography (GC) was the earliest chromatographic technique to be interfaced to a mass spectrometer. The original type of gas chromatograph had a packed GC column with a gas flow rate passing through it at ca 20 ml/min and the major problem was how to interface the GC without losing the mass spectrometer vacuum.
Gas chromatography-mass spectrometry (GC-MS) • This was solved by use of a jet separator where the column effluent was passed across a very narrow gap between two jets and the highly diffusable carrier gas was largely removed, whereas the heavier analyte molecules crossed the gap without being vented. The problem of removing the carrier gas no longer exists since GC capillary columns provide a flow rate of 0.5-2 ml/min, which can be directly introduced into the mass spectrometer without it losing vacuum.
Gas chromatography-mass spectrometry (GC-MS) • This was solved by use of a jet separator where the column effluent was passed across a very narrow gap between two jets and the highly diffusable carrier gas was largely removed, whereas the heavier analyte molecules crossed the gap without being vented. The problem of removing the carrier gas no longer exists since GC capillary columns provide a flow rate of 0.5-2 ml/min, which can be directly introduced into the mass spectrometer without it losing vacuum.
Liquid chromatography-mass spectrometry (LC-MS) • The interfacing of a liquid chromatograph to a mass spectrometer proved much more difficult than interfacing a gas chromatograph since each mole of solvent introduced into the instrument produces 22.4 I of solvent vapour, even at atmospheric pressure. • The technique has made huge advances in the last 10 years and there are many types of interface available, the most successful of which are the electrospray and atmospheric pressure ionisation sources. • In many cases, LC flow rates have to be in the range 10-100μL per min so that either splitting of the eluent from a normal column is required or microbore chromatography is used.
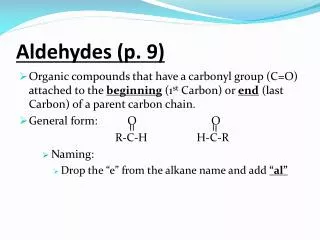
Examples of mass spectra Alcohol: An alcohol's molecular ion is small or non-existent. Cleavage of the C-C bond next to the oxygen usually occurs. A loss of H2O may occur as in the spectra below. 3-PentanolC5H12OMW = 88.15