Download
1 / 11
110 likes | 278 Views
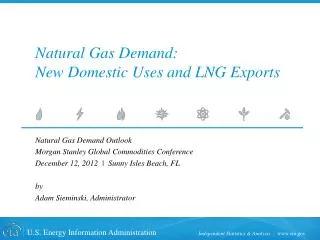
Natural Gas Demand: New Domestic Uses and LNG Exports. Natural Gas Demand Outlook Morgan Stanley Global Commodities Conference December 12, 2012 | Sunny Isles Beach, FL by Adam Sieminski, Administrator . Shale gas leads growth in production through 2040. U.S. dry natural gas production

E N D
Natural Gas Demand:New Domestic Uses and LNG Exports Natural Gas Demand Outlook Morgan Stanley Global Commodities Conference December 12, 2012 | Sunny Isles Beach, FL by Adam Sieminski, Administrator
Shale gas leads growth in production through 2040 U.S. dry natural gas production trillion cubic feet Source: EIA, Annual Energy Outlook 2013 Early Release History Projections 2011 Shale gas Tight gas Non-associated offshore Alaska Coalbed methane Associated with oil Non-associated onshore Adam Sieminski December 12, 2012
Natural gas consumption is dispersed with electric power, industrial, and transportation use driving future demand growth U.S. dry gas consumption trillion cubic feet Source: EIA, Annual Energy Outlook 2013 Early Release History Projections *Includes combined heat-and-power and lease and plant fuel. **Includes pipeline fuel. Electric power 32% 31% Industrial* 33% 33% 2% Gas to liquids 6% 3% Transportation** 13% 12% Commercial 19% 14% Residential Adam Sieminski December 12, 2012
Electricity generation mix shifts toward natural gas and renewables, but coal remains the largest fuel source U.S. electricity net generation trillion kilowatthours Source: EIA, Annual Energy Outlook 2013 Early Release History Projections 1993 2011 30% Natural gas 25% 16% Renewables 13% 13% 11% 19% 17% Nuclear 19% 35% 42% 53% Coal Oil and other liquids 4% 1% 1% Adam Sieminski December 12, 2012
Industrial natural gas use grows, especially before 2025 Industrial natural gas consumption quadrillion Btu Source: EIA, Annual Energy Outlook 2013 Early Release Adam Sieminski December 12, 2012
Natural gas use in transportation rises as motor gasoline demand declines… overall transportation use is largely unchanged Source: EIA, Annual Energy Outlook 2013 Early Release Transportation energy consumption by fuel quadrillion Btu History Projections 2011 22% Diesel 29% CNG/LNG 11% 4% 4% Jet fuel 13% 2% E85 Other 1% 4% 3% Pipeline fuel 60% Motor gasoline 47% Adam Sieminski December 12, 2012
Growth of natural gas in transportation led by heavy duty trucks (LNG) and gas to liquids (diesel)… marine and rail to come? U.S. natural gas consumption quadrillion Btu Note: Gas to liquids includes heat, power, and losses. Source: EIA, Annual Energy Outlook 2013 Early Release History Projections 2011 28% Gas to liquids Freight trucks 38% 1% 3% Buses 1% 1% Light-duty vehicles 3% Pipeline fuel 31% 95% Adam Sieminski December 12, 2012
Domestic natural gas production grows faster than consumption and the U.S. becomes a net exporter of natural gas around 2020 U.S. dry gas trillion cubic feet Source: EIA, Annual Energy Outlook 2013 Early Release History Projections 2011 Consumption Domestic supply Net imports Adam Sieminski December 12, 2012
Total natural gas exports nearly quadruple by 2040 in the AEO2013 Reference case U.S. natural gas exports trillion cubic feet Source: EIA, Annual Energy Outlook 2013 Early Release Exports to Mexico Exports to Canada Lower 48 LNG exports Alaska LNG exports Adam Sieminski December 12, 2012
Regulations for LNG export licenses Two key federal agencies are involved in LNG export licenses. The Federal Energy Regulatory Commission (FERC) licenses the export facilities (LNG plants and terminals). The Department of Energy’s Office of Fossil Energy (DOE/FE) is responsible for a public interest determination. • Federal law generally requires approval of natural gas exports to countries that have a free trade agreement (FTA) with the United States. • For countries that do not have an FTA, the DOE is required to grant applications for export authorizations unless the proposed exports "will not be consistent with the public interest." Factors for consideration include economic, energy security, and environmental impacts. • On August 7, 2012, Cheniere Marketing, LLC was granted a non-FTA license for up to 2.2 Bcf per day over 20 years. On December 5, 2012, the DOE/FE released a consultant study (NERA) on the economic impact of LNG exports, and invited comments. The NERA report will become part of the 15 pending export application dockets. • DOE/FE expects to act on the applications on a case-by-case basis, starting with applicants which have already commenced the pre-filing process at FERC. Adam Sieminski December 12, 2012
For more information U.S. Energy Information Administration home page | www.eia.gov Annual Energy Outlook | www.eia.gov/forecasts/aeo Short-Term Energy Outlook | www.eia.gov/forecasts/steo International Energy Outlook | www.eia.gov/forecasts/ieo Today In Energy | www.eia.gov/todayinenergy Monthly Energy Review | www.eia.gov/totalenergy/data/monthly Annual Energy Review | www.eia.gov/totalenergy/data/annual Adam Sieminski December 12, 2012