Download
1 / 143
1.43k likes | 1.57k Views
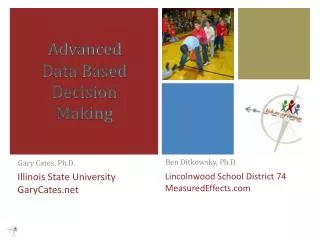
Advanced Data Based Decision Making. Gary Cates, Ph.D. Lincolnwood School District 74 MeasuredEffects.com. Illinois State University GaryCates.net. Ben Ditkowsky, Ph.D. A Model of What RtI Might Look Like In Your School. Universal Screening. Common Assessments. Language!

E N D
Advanced Data Based Decision Making Gary Cates, Ph.D. Lincolnwood School District 74MeasuredEffects.com Illinois State University GaryCates.net Ben Ditkowsky, Ph.D.
Universal Screening Common Assessments Language! Corrective Reading Reading Mastery I - V Horizons A, B Typical Instruction with differentiation Tri-annual screening / ODR Grade level teams Discuss ALLstudent performance Typical scores (above 25%ile) Poor performance AMP Horizons A/B, C/D Jolly Phonics Review Data Are scores typical? Teacher Judgment YES NO • Grade Level Team • Define the scope of the problem • Define a goal for success • Plan / communication • Implement • Follow-up Typical scores Prentice Hall Houghton Mifflin Fountas and Pinnell Making Meaning Jolly Phonics Teacher disagrees retest Reconfigure goal and documentation NO Low scores (<25th%ile) Standard Intervention, progress monitoring, and communication. Student on watch list Standard progress monitoring, and communication. Problem-solving within intervention appropriate Is there a problem? Student difficulty? NO Low scores Is there a problem? (within 4 wks) YES NO YES Low probability of success with standard intervention • Adjust • Focus • Strategy • Motivation • Time • Materials Manageable with Typical resources? Manageable within intervention YES NO Implement Powerful Tier 3 intervention; Collect additional data, set follow-up NO School Problem-Solving Team Has the student received a powerful scientifically-based intervention? NO Review of Curriculum, Instruction, Env. and Learner chrs, including data from state and local asmt, interventions, and the class, communication (staff /parents) Complete special education evaluation Sufficient data? YES Yes
BIG IDEA #1 Service is determined by need Intensity of service is determined by what it takes to be successful. Special Education Eligibility comes after we determine the intensity, and if that service can not be maintained in General education. Example RtI Manual: http://sd74.org/home/files/RTI/RtI_Manual_2009.pdf
Alternatively, RtI Might Look A Little Different In Your School
Lincolnwood School District 74 Ben Ditkowsky, Ph.D. Using Data For Grouping Students into Interventions
With Whom Do We Intervene? ? CAN’T CAN DOESN’T DOES respecify Not Fluent Fluent Implications TEACH Practice Motivate Adapted from Gresham, Sugai and Horner, 2001
When Grouping Students We Should Consider The Source We need to intervene with students who do not have the skills to be successful, or those who have the skills but have not sufficiently mastered the skills to be successful independently.
MAP Scantron Performance CBM (DIBELS / Aimsweb) Common Grade Level Assessment (s) ISAT EXPLORE, PLAN ________________ ________________ ________________ ________________ ________________ ________________ What Data Do You Have or Collect?
Good Practices Questions Thoughts from the Group
Two Factors To Consider When Using Multiple Points of Assessment • Convergence: Agreement or Overlap, a representation of common ground between theories – i.e., Do most assessments result in similar conclusions? • Magnitude: The property of relative size or extent (whether large or small) – i.e., How large is the need?
Convergence • The question of convergence is • To what degree does all of the assessment data indicate a need for the decision you are considering? • If more than half of the assessments examined indicate a need for something different than what is typical, then we should at least consider something different.
If There Is Not Convergence • Then we can discount a single indicator of magnitude because • It is likely that the poor test score is the result of a bad day
Magnitude • The question of magnitude is • How Much of a Difference in Programming is Required? • If there are more indications that the difference between the student and typical peers is large then small, then more intensive service should be considered.
How Can We Use Convergence and Magnitude to Make Intervention Groups? • Step 1. What data will you use? • Step 2. What are the cut scores indicating a difference requiring additional assistance? What is the cut score indicating a need for substantial assistance? • Step 3. Classify each score as Risk versus No Risk • Step 4. Determine convergence, list scores with >50% convergence • Step 5. Sort by Magnitude • Step 6. Meet with teachers to validate decisions
Step 1. What data will you use? • Previous State Test Scores • EPAS Scores • CBM Scores • Grade Level Common Assessment Scores • Vocabulary Matching
Step 6. Meet with Teachers to Validate Decisions • Sometimes there is additional data that are relevant to groupings
Your Turn • Determine Convergence for the following
Your Turn • Determine Magnitude for the following
BIG IDEA #2 • Two factors to consider when grouping students for intervention are convergence of data and the magnitude of the problem. Placement in intervention is ideally based on multiple converging sources of data. The intensity of service that a student receives is based on the magnitude of the problem not whether the students has unsuccessfully jumped through hoops.
Problem Identification To Solve A Problem, First We Need To Define It
If The Student Can Not Do What Is Expected • We need to determine a starting point for intervention? • Does this call for a quick fix or a comprehensive intervention? • If the student’s performance is significantly below peers, we need to consider if a powerful Tier 3 Intervention has been implemented with Fidelity before consideration of Special Education.
If The Student Can Do What Is Expected But Not Very Good At It... Whether the task is academic or behavioral we all tend to avoid doing things we are not good at doing The intervention should focus on building automaticity with the task
If The Expectation Is Too Easy, Idle hand are the devil’s playthings
Motivation Motivation = Expectation x Value Motivation = Expectation x Value Sprick, Garrison & Howard
Would The Student Say It’s Easy? • If the teacher thinks the student can do it, but the student does not, then the intervention should focus on getting the student to see that they CAN do it. • Remember, this is from the student’s perspective.
Does The Student Value Doing It? • When internal motivation is lacking, sometimes we need something else.
If Other Students Encourage The Problem The intervention should focus on teaching the student about more appropriate ways to get peer attention • Getting Peers to ignore problem behavior • Getting peers to reinforce appropriate behavior
Does The Student Want Adult Attention? • The intervention should focus on teaching more appropriate ways to get adult attention • Be Clear about expectations • Provide Specific Praise • Ignore minor infractions
Is The Student Just Overwhelmed? If the student is overwhelmed with the quantity of work, the intervention might focus on first improving quality in exchange for quantity, then gradually increase the amount of work
If The Problem Is Simply Not Enough Work, Then We Are Back To Contracting, or else…
BIG IDEA #3 Solving Problems is based on identifying a focal point for intervention.
Module D. Progress Monitoring
rogress Monitoring Progress Monitoring is used to understand student performance and to adjust instruction
How Often We Monitor Progress Depends On How Quickly We Want To Be Able To Make A Decision
Goal Setting For Progress Monitoring Setting goals is a value driven activity Three Methods Standards Based Goals This type of goal would indicate that a student who meets the expectation is likely to meet standards (either grade level or state test). Norm Referenced Goals This type of goal would indicate that a student who meets the expectation is likely to be successful working with in a group with typical students. Growth Referenced Goals This type of goal would indicate that a student who meets the expectation is making progress relative to their own level of achievement, even though it may still be substantially below either normative information or standards.
Goal Examples From a High Performing District Growth Referenced reasonable rate ~ 1.2 Normative 25th percentile = 125 Standards Based = 115
Goal Examples From a High Performing District Normative 25th Standards Based Growth Referenced
The Decision You Make Regarding Progress Depends on The Goal We Set Normative 25th Standards Based Growth Referenced
BIG IDEA #4 The type of goal that we set (i.e., standard, normative, or growth referenced) have different strengths, weaknesses and implications.