Download
1 / 1
10 likes | 127 Views
Variability in Ozone Profiles at TexAQS within the Context of an US Ozone Climatology Mohammed Ayoub 1 , Mike Newchurch 1 2 , Brian Vasel 3 Bryan Johnson 3 , Sam Oltmans 3 , Richard McNider 1 1. Department of Atmospheric Science, University of Alabama in Huntsville, USA

E N D
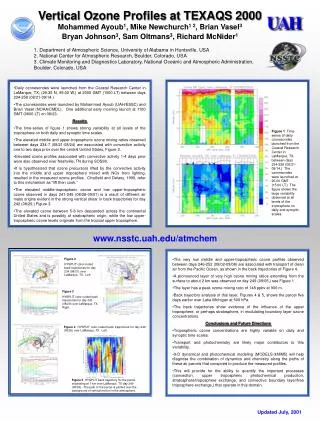
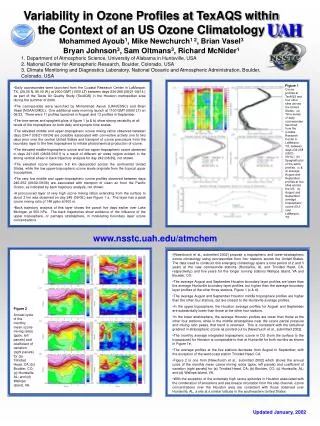
Variability in Ozone Profiles at TexAQS within the Context of an US Ozone Climatology Mohammed Ayoub1, Mike Newchurch1 2, Brian Vasel3 Bryan Johnson3, Sam Oltmans3, Richard McNider1 1. Department of Atmospheric Science, University of Alabama in Huntsville, USA 2. National Center for Atmospheric Research, Boulder, Colorado, USA 3. Climate Monitoring and Diagnostics Laboratory, National Oceanic and Atmospheric Administration, Boulder, Colorado, USA Figure 1Ozone profiles at TexAQS and four other sites across the United States. (a) Time-series of daily ozonesondes launched from the Coastal Research Center in LaMarque, TX, between days 234-258 (08/21-09/14.) (b) Spaghetti plot of the same profiles. (c & d) average August and September profiles at five sites across the US. (e) August and September average tropospheric ozone (DU) over LaMarque, TX. • Daily ozonesondes were launched from the Coastal Research Center in LaMarque, TX, (29.35 N, 95.00 W,) at 2000 GMT (1500 LT) between days 234-258 (08/21-09/14.) as part of the Texas Air Quality Study (TexAQS) in the Houston metropolitan area during the summer of 2000. • The ozonesondes were launched by Mohammed Ayoub (UAH/ESSC) and Brian Vasel (NOAA/CMDL). One additional early morning launch at 1100 GMT (0600 LT) on 08/23. There were 11 profiles launched in August and 13 profiles in September. • The time-series and spaghetti plots of figure 1 (a & b) show strong variability at all levels of the troposphere on both daily and synoptic time scales. • The elevated middle and upper-tropospheric ozone mixing ratios observed between days 234-7 (08/21-08/24) are possibly associated with convective activity one to two days prior over the central United States and transport of ozone precursors from the boundary layer to the free troposphere to initiate photochemical production of ozone. • The elevated middle-tropospheric ozone and low upper-tropospheric ozone observed in days 241-245 (08/28-09/01) is a result of different air mass origins evident in the strong vertical shear in back trajectory analysis for day 242 (08/29), not shown. • The elevated ozone between 5-8 km descended across the continental United States, while the low upper-tropospheric ozone levels originate from the tropical upper troposphere. • The very low middle and upper-tropospheric ozone profiles observed between days 246-252 (09/02-09/08) are associated with transport of clean air from the Pacific Ocean, as indicated by back trajectory analysis, not shown. • A pronounced layer of very high ozone mixing ratios extending from the surface to about 2 km was observed on day 249 (09/05,) see Figure 1 a. The layer has a peak ozone mixing ratio of 148 ppbv at 900 m. • Back trajectory analysis of this layer shows the parcel five days earlier over Lake Michigan at 500 hPa. The back trajectories show evidence of the influence of the upper troposphere, or perhaps stratosphere, in modulating boundary layer ozone concentrations. www.nsstc.uah.edu/atmchem • [Newchurch et al., submitted 2002] propose a tropospheric and lower-stratospheric ozone climatology using ozonesondes from four stations across the United States. The data used to construct this emerging climatology spans a time period of 2 and 3 years at the new ozonesonde stations (Huntsville, AL and Trinidad Head, CA, respectively,) and five years for the longer running stations Wallops Island, VA and Boulder, CO. • The average August and September Houston boundary layer profiles are lower than the average Huntsville boundary layer profiles, but higher than the average boundary layer profiles at the other three stations, Figure 1 (c & d). • The average August and September Houston middle troposphere profiles are higher than the other four stations, but are closest to the Huntsville average profiles. • In the upper troposphere, the Houston average profiles for August and September are substantially lower than those at the other four stations. • In the lower stratosphere, the average Houston profiles are lower than those at the other four stations, while in the middle stratosphere near the ozone partial pressure and mixing ratio peaks, that trend is reversed. This is consistent with the latitudinal gradient in stratospheric ozone as pointed out by [Newchurch et al., submitted 2002]. • The monthly average integrated tropospheric ozone in DU (from the surface to the tropopause) for Houston is comparable to that at Huntsville for both months as shown in Figure 1e. • The average profiles at the five stations decrease from August to September, with the exception of the west coast station Trinidad Head, CA. • Figure 2 is one from [Newchurch et al., submitted 2002] which shows the annual cycle of the monthly mean ozone mixing ratios (ppbv, left panels) and coefficient of variation (right panels) for (a) Trinidad Head, CA; (b) Boulder, CO; (c) Huntsville, AL; and (d) Wallops Island, VA. • With the exception of the extremely high ozone episodes in Houston associated with the combination of emissions and sea breeze circulation from the ship channel, ozone concentrations over the Houston area are consistent with those observed over Huntsville, AL, a site at a similar latitude in the southeastern United States. Figure 2 Annual cycle of the monthly mean ozone mixing ratios (ppbv, left panels) and coefficient of variation (right panels) for (a) Trinidad Head, CA; (b) Boulder, CO; (c) Huntsville, AL; and (d) Wallops Island, VA. Updated January, 2002