Tree Species Diversity
Tree Species Diversity. Cameron and Rachael Introduction to Local Biomes Module 2. Introduction. Rain forests are unquestionably among the most intricate, sensitive, endangered and unknown ecosystems on Earth

Tree Species Diversity
E N D
Presentation Transcript
Tree Species Diversity Cameron and Rachael Introduction to Local Biomes Module 2
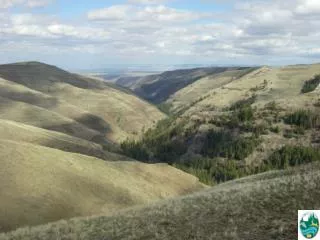
Introduction • Rain forests are unquestionably among the most intricate, sensitive, endangered and unknown ecosystems on Earth • This study consists of the familiarization with the local ecology by mapping the different number of trees within certain areas.
Introduction (continued) • Factors that provide the structure of a local biome are either biotic or abiotic. • Abiotic factors can be rainfall, slope and topography • Biotic factors may be such things as the presence of an animal species that contributes to dispersal or absence of a predator species. • Another important factor in the composition of the biodiversity is area. Larger areas will have more species.
Methodology • Standard for tree measurements was a height of 1.35m and a circumference of 15cm. • Plots were created with areas of: 5 x 5m, 5 x 10m, 10 x 10m, 10 X 20m, and 20 x 20m. • The first plot studied was smallest (5 x 5m) and then with respect to increasing area with the largest plot (20 x 20m). • For each plot the morphospecies was noted as well as the number of each of those specific trees • Descriptions were made for each tree species found
Number of Trees and Individual Species per plot for Group A’s first site
Number of Trees and Individual Species per plot for Group B’s first site
Number of Trees and Individual Species per plot for Group A’s second site
Number of Trees and Individual Species per plot for Group B’s second site
Discussion • All sites experienced generally the same abiotic conditions. These conditions should have similar effects on biodiversity • From these results, it was seen that tree species diversity generally increases as the area is increased. • However, the species area curve graphs suggests that there is a limit to species diversity.