Download
1 / 26
260 likes | 373 Views
This presentation highlights issues related to the 2011 emissions modeling platform focused on Non-Electric Generating Units (Non-EGU). It discusses the 2011 National Emissions Inventory (NEI)-based platform, targeting specific Non-EGU source categories, and compares their contributions to total emissions from 2007 to the newly projected values for 2018. Emphasis is on methodologies, limitations, and future considerations for emissions projections. The session invites public comments and outlines steps for public release of data, addressing regional and local concerns in emissions inventory and analysis.

E N D
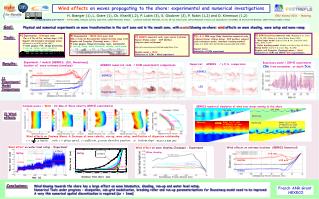
Key Non-EGU Projections Issues for the 2011 Emissions Modeling Platform 12th Annual CMAS Conference, Chapel Hill NC Emissions Inventories, Models, and Processes Session October 29, 2013 Rich Mason, Alison Eyth, Alexis Zubrow
Overview • 2011 NEI-based Platform • Non-EGU source categories targeted • Non-EGU comparison to 2007 platform of relative contribution to total anthropogenic emissions • First Projection Year is 2018 • General approach and background • What is new in 2018 projections? • Details of approaches used • Limitations and areas of future concern • Status of Non-Electric Generating Unit (EGU) projections • Emissions for public release • Comment and review requested • Next steps OAQPS, Emission Inventory and Analysis Group
2011 NEI-based Platform • NEI Version 1 publicly-released September 30, 2013 • CAPs + HAPs • Mostly annual • SMOKE-MOVES-based onroad mobile county emissions • Emissions Modeling Files (FF10) to be released soon • Includes monthly onroad and nonroad county/SCC-level • Hourly Continuous Emissions Monitoring System (CEMS) data • Point-format daily wildfires and prescribed burning and process-level EGU and non-EGU point sources • Similar sources as 2007 platform, including biogenics • Includes: CAPs + some HAP (“lite”) emissions, ancillary inputs and scripts • Limited activity data for onroad mobile sources also included • Seeking review and comments on emissions and ancillary inputs from public, states/locals/regions, RPO • Will be used for Transport Rule, O3 NAAQS, NATA and more OAQPS, Emission Inventory and Analysis Group
Non-EGU Source Categories Targeted for Projections • Targeted Inventories: • Non-EGU point sources • Nonpoint sources including CMV & trains • Specific projections inputs: • Plant/unit closures, consent decrees/settlements & controls • Various sources of projection factors, discussed later • Projected via other methods: • EGUs: IPM v5.13 • Onroad mobile: SMOKE-MOVES + TX/CA emissions • Nonroad mobile: NMIM/NONROAD monthly/county/SCC • Not targeted: • Canada (2006) and Mexico (2018 from 1999) • Biogenics, fires, most non-US emissions OAQPS, Emission Inventory and Analysis Group
Non-EGU Contribution to Total Emissions: NOX 2007 2011 2018 (based on 2007) Total Anthropogenic NOX OAQPS, Emission Inventory and Analysis Group
Non-EGU Contribution to Total Emissions: SO2 2007 2011 2018 (based on 2007) Total SO2 OAQPS, Emission Inventory and Analysis Group
Non-EGU Contribution to Total Emissions: PM2.5 2007 2011 2018 (based on 2007) Total PM2.5 OAQPS, Emission Inventory and Analysis Group
Approach to Non-EGU Projections • Start with existing set of COntrol Strategy Tool (CoST) datasets from 2007 platform, organized by control program types/sources targeted • Appendices E & F from TSD: http://epa.gov/ttn/chief/emch/2007v5/2007v5_TSD_Appendices_14dec12.pdf • CoST datasets documented in Section 4.2 of the 2007 TSD: http://epa.gov/ttn/chief/emch/2007v5/2007v5_2020base_EmisMod_TSD_13dec2012.pdf • 3 types of CoST packets (# in 2007 platform): • CLOSURES (5): 100% reduction for facility, (optional down to process-level), includes effective date • CONTROL (14): Variables can include state/county FIPS, pollutant, SCC, facility-to-stack, NAICS, replacement flag, compliance date and % reductions • PROJECTION (8): similar to CONTROL packet key fields but no compliance dates and expressed as fractions • Additional ways to apply control measures, incremental controls are available • CoST User’s Guide available at: http://www.epa.gov/ttnecas1/models/CoST_CMDB_Document_2010-06-09.pdf OAQPS, Emission Inventory and Analysis Group
Specific Approaches to 2011 Non-EGU Projections • Pick a year, 2018 for 2011 platform –others to follow • Evaluate relevance of existing set of packets: • Have programs been partially/fully implemented in updated base year (i.e., 2011)? • Are these programs partially/fully implemented by target future year (i.e., 2018)? Example: Fuel sulfur rules, Renewable Fuel Standards (RFS2) • Are there any methodology improvements? Example: oil & gas, residential wood combustion (RWC) • Any regulatory or enforcement (consent decrees) changes? Example: Reciprocating Internal Combustion Engines (RICE) NESHAP, & Boiler MACT Reconsideration OAQPS, Emission Inventory and Analysis Group
Specific Approaches to 2011 Non-EGU Projections (cont.) • Update to new base and future year(s) • Consideration of control programs/measures that may already be incorporated in the updated base year –NEI controls information often lacking • Priority to programs/measures with largest impacts and areas of geographic/temporal concern (NAAs, RWC) • Collaborate with EPA, RPO, state & local experts on improved techniques & data, examples include: • Oil & gas • Cement • RWC • Consent decrees/settlements OAQPS, Emission Inventory and Analysis Group
Hierarchy of PROJECTIONS & CONTROLS application OAQPS, Emission Inventory and Analysis Group
Context: from 2007 Platformnon-EGU stationary (ptnonipm + nonpt) reductions OAQPS, Emission Inventory and Analysis Group
Context: from 2007 PlatformHigh-impact non-EGU stationary (ptnonipm + nonpt) programs Changes: SO2 Changes: NOX OAQPS, Emission Inventory and Analysis Group
What’s New for 2011 Platform Projections (under development) • Outreach: public release prior to proposed or final rulemaking • Oil and Gas production w/ limited NSPS • Residential Wood Combustion (RWC) • Airport-specific projections • Revised ISIS-based methodology for cement manufacturing • Updated Emission Inventory System (EIS)-based closures information OAQPS, Emission Inventory and Analysis Group
Oil & Gas Projections • Based on estimated Annual Energy Outlook (AEO) 2013 regional 2011-2018 growth factors • Oil production, natural gas production, and combined oil & natural gas activities (summed o&g production levels barrel-of-oil equivalents, 0.178 bbl crude oil = 1,000 ft3 natural gas) • EIA county-NEMS (National Energy Modeling System) region cross-walk • SCCs impacted by NSPS verified w/ EPA SPPD & OAP: • Reduction factors estimated from Climate Action Report • Assumed NSPS affects new activities in future, reduces increases ONLY • Natural gas well completion-related activities are “one-shot”, so all emissions reduced, not just “growth” OAQPS, Emission Inventory and Analysis Group
Oil & Gas Projections (cont.) • Net growth rates computed from AEO growth + NSPS controls + other assumptions: • No replacement of capital via NSPS, only affects growth • Emissions change linearly with production level changes • Does not account for engine-related regulatory impacts (e.g. RICE) or oil & gas NESHAP OAQPS, Emission Inventory and Analysis Group
Oil & Gas NEMS Regions OAQPS, Emission Inventory and Analysis Group
Oil & Gas Draft Projection Estimates of VOC OAQPS, Emission Inventory and Analysis Group
Cement Manufacturing • Industrial Sectors Integrated Solutions (ISIS) model (Aug 2013 version) projects cement kilns from 2011 to 2015-2030 for most CAPs, HCL and Hg • Portland Cement Association (PCA) plant information summary from 12/31/10 • July 2012 outlook using 2011 NEI and 2015 NESHAP controls • Production increases 65% from 2011 (71M tons) to 2018 (117M tons) • But NOX only increases 46% and SO2 decreases 13% and PM decreases 74% • Also new: • treatment of ISIS-generated new kilns as nonpoint sources • Projections applied at state-level rather than kiln level + QA • Permitted new kilns still treated as point sources OAQPS, Emission Inventory and Analysis Group
Residential Wood Combustion • Factors by SCC for PM2.5, VOC and CO through 2035 • 3 options: • BAU (business as usual) • Draft proposed NSPS (2-step) • Alternative NSPS (3-step) • Going with BAU –standard practice • Growth based on 2012 shipments (Frost & Sullivan) by appliance type • For certified wood stoves, pellet stoves, indoor furnaces & hydronic heaters, assumes correlated w/ revenue growth 2013-2035 (GDP via US BEA) ~2%/yr • Modest replacement rates assumed for these appliance types, similar to 2007 platform assumptions • Fireplaces, outdoor NEC & firelogs based on 2002-2012 national number of houses ~1%; no replacement assumed • Special procedure under development for CA, OR and WA likely involves “no net growth” in RWC OAQPS, Emission Inventory and Analysis Group
RWC Draft PM2.5 Projections OAQPS, Emission Inventory and Analysis Group
Public Release of Projected Emissions • EPA posts emissions platform data, including projections, once available, on the CHIEF Emissions Modeling Clearinghouse • http://www.epa.gov/ttn/chief/emch • 2018 projections should be posted by the end of the year • Once developed, Technical Support Documentation will describe the projections-related packets • Data release will include a full set of non-EGU point, nonpoint (including CMV & trains) CLOSURE, CONTROL and PROJECTION packets • Year 2011 to 2018 emissions summaries/impacts for base and future year & summaries of CLOSURE, CONTROL and PROJECTION packets will also be included OAQPS, Emission Inventory and Analysis Group
Limitations and Areas for Future Improvement • NEI control information • Canada emissions are year 2006 • Mexico emissions are 2018 but projected from 1999 inventory (MNEI). • RWC “BAU” approach vs NSPS options, burn bans & local base and future year AQM inventories • Oil & gas w/ NSPS, speciation/spatial/temporal? • Revisit high-impact rules such as Boiler MACT, ULSD • Upstream RFS2 impacts • Industrial non-EGU sources • Commercial Marine Vessel (CMV), particularly C3 data based on pre-Great Recession projections OAQPS, Emission Inventory and Analysis Group
Projections Next Steps • Develop 2011 platform CoST packets. Apply in CoST, QA, summarize and develop public TSD • Public outreach: states, RPOs, industry, and all other for additional data. 3 stages of outreach. • Gather preliminary comments/data for next set of projections (2018 or possibly other regulatory effort) • Ultimately, develop an updated version of the 2011 platform with 2018 projections for final rule-makings OAQPS, Emission Inventory and Analysis Group
Acknowledgements Emissions Modeling Team: Alison Eyth, Alexis Zubrow, Darin Del Vecchio NEI Team: Roy Huntley, Madeleine Strum EIAG Group Leader: Marc Houyoux AQMG: Norm Possiel, Brian Timin HEID/SPPD: Alex MacPherson, Melanie King, Elineth Torres OTAQ: Rich Cook, Margaret Zawacki Many others inside and outside EPA! OAQPS, Emission Inventory and Analysis Group
Questions? OAQPS, Emission Inventory and Analysis Group