Download

1 / 20
200 likes | 327 Views
Automation of the NSW Cost Data Collection. Patrick Power. 2008 PPM User Conference. Hospital DBs. SAS Statistics Package. Microsoft Access. End Users. Benchmark Report. NSW Health Health Information Exchange (HIE). Problem. Emailed data submission. Distribution to report end-users.

E N D
Automation of the NSW Cost Data Collection Patrick Power 2008 PPM User Conference
Hospital DBs SAS StatisticsPackage Microsoft Access End Users BenchmarkReport NSW HealthHealth Information Exchange (HIE) Problem Emailed data submission Distribution to report end-users Data export Extraction of additional data The current solution only provides a static report to hospitals and is time-consuming to maintain
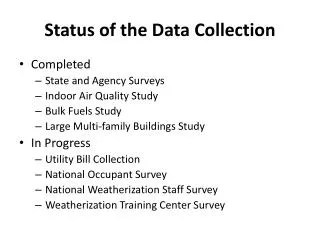
Problem Summary • Annual data collection from public hospitals • Hospital flat files imported into SAS for validation & performance analysis • Time-consuming to prepare and error-prone • Provides limited data back to the hospitals • Access DB cannot be distributed for further reporting
PowerBusiness Reporting ReportingDatabase PowerPerformance Management Internet Existing Data Health Information Exchange (HIE) End Users HospitalsCommonwealthGovernment Solution Request, receive & validate data Automatic export and upload Data availability Enrich incoming data with HIE reference feeds Interactive reporting environment
Solution Summary • PPM will perform data quality checks on the costing data with each database calculate • Provides Areas with real-time error checking which gives them more time to review and correct their costing errors • A custom automatic data export and upload utility will be developed for PPM to allow for easy upload of data to the Department’s Reporting Database • Transmissions will be received via a custom web application developed using ASP.Net 2.0 • Each hospital will be able to monitor the progress of their data upload for any given reporting period • The Department will have access to a web-based utility that will monitor the status of all data uploads • Once all data uploads are complete, the incoming data will be validated before a reporting database is generated.
Validations in PPM • Negative costs at an episode & cost output level should not exist • Negative costs should be corrected by going back to the GL and netting any negative amounts against the appropriate offsetting account code • Costs at a service code level (test) are outside expected boundaries when compared to the service code’s previous year’s costing results • Costs at an episode and/or cost output level that are outside expected boundaries for the patient’s DRG • Costs at an episode and/or cost output level that are outside expected boundaries when compared to the Areas previous year’s costing results • Costs per day at an episode level are outside expected boundaries for the patient’s DRG • Direct costs as a percent of total costs are outside expected boundaries for the patient’s DRG • Costs at an episode level with Theatre DRGs where the Theatre Cost Output is outside expected boundaries for the patient’s DRG • Costs at an episode level with Theatre DRGs where the Prosthesis Cost Output is outside expected boundaries for the patient’s DRG.
Validations on Shared Server • Using the UAR for expenses and FTEs, dividing FTEs by their corresponding expenses, are the rates within acceptable boundaries: • Average Nursing Salary per FTE > $85000 • Average Medical Salary per FTE > $205000 • Average Diag and Health Prof Salary per FTE > $85000 • Average Admin and Clerical Salary per FTE > $85000 • Average Domestic and Personal Care Salary per FTE > $65000 • Average Nursing Salary per FTE < $40000 • Average Medical Salary per FTE < $100000 • Average Diag and Health Prof Salary per FTE < $40000 • Average Admin and Clerical Salary per FTE < $30000 • Average Domestic and Personal Care Salary per FTE < $30000 • Total of Salaries not equal to Expenses for Line Item 100
Validations on Shared Server • Using UAR, is there a large percentage change in each item from previous years • Using UAR, has something been reported this year, that wasn’t in previous years • Has ED been reported • Average DRG costs comparable to previous years • Direct cost as a proportion of total cost • Negative cost buckets • Theatre DRGs with zero costs in the OR bucket • DRGs with Prosthesis cost outside of the limits • DRG L61Z should be between $200 and $800 and DRG R63Z between $300 and $700?
Reports and Other Outputs • Cost Database and some or all of the existing 28 reports • HCDC and NHCDC reports • The NSW Hospital Cost Data Collection • The National Hospital Cost Data Collection • The Sub and Non Acute Admitted Patient Costing • AHCA and AIHW reports • Internal Audit Reports
Digital Dashboard Reporting Database Central Reporting Services Executive Reporting End Users HospitalsCommonwealthGovernment OLAP Reporting Central Reporting Services Unifies the reporting products to simplify access and management Data stored in the reporting database presented by PHS reporting products Access to PHS Reporting Products as configured Single sign-on
Central Reporting Services • Controls • User management • Group (role) management • Product access • Other system configuration utilities • Single sign-on interface to PHS reporting products • Allowing users to access permitted products from a single location • Users enter their username and password once only.
Benefits for NSW Health • Eliminates the need for an additional resource to collate and process data, prepare the standard report and prepare custom reports as requested by participating hospitals. • Ability to increase the frequency of data collection and reporting from annual to quarterly or monthly ― increase timeliness and relevance of reports generated by the system, even allowing test runs before the full data set is collected. • More robust and intelligent tracking of the status of the data upload for any given period • Each participating hospital will be able to track the status of their own data upload to ensure that the system has correctly received their data submission and that the data conforms to the required format. • The Department will be able to track the overall status of the data collection process for a given reporting period via a user-friendly interface and will eliminate the manual tracking that occurs as part of the current system. • Automate the data processing and reporting procedure ― eliminate the potential for introducing human error • Centrally manage user permissions ― single-signon functionality permitting a user access to all authorised products with a single username and password.
Benefits for Participating Hospitals • Access to a more sophisticated data uploading utility that protects the sensitive data in transit. The current system receives data via email, a transport mechanism that is considered insecure. • Easier to submit and monitor the uploading of data to the Department via a web-based tracking utility. • Access to raw benchmark files to enable the hospitals to include performance figures in their own reports or to perform their own performance analysis. • OLAP Reporting― allow participating hospitals to analyse data within the reporting database via a high-powered and real-time data analysis interface. • Digital Dashboard― enable the participating hospitals to visually compare their results with the performance metrics of other participating hospitals. The hospitals will be able to set alerts to ensure they can monitor their performance on a by-exception basis. • Executive Reporting― give the hospitals access to detailed (Crystal) reports. These can be configured to be delivered automatically to the participating hospitals via email or accessed via PHS’ Central Reporting Services product. This will eliminate the need for hospitals to request reports from the Department. • Central Reporting Services― access to all products with a single username and password with seamless switching between products.
0 Weeks 5 Weeks 10 Weeks 15 Weeks 20 Weeks Design 2 Weeks Development 8 Weeks Testing 4 Weeks Implementation and hand-over 6 Weeks Training 4 Weeks Estimated Delivery Timeline Delivery of the proposed solution is estimated to be 20 weeks
Data Uploader …2 Upload status indicators Uploaded data filters
Digital Dashboard Available KPIs Dashboard controls. Allows the user to save KPI layout configurations to allow easy access in the future. Dashboard work area Saved alert sets. Allows management by exception
Executive Reporting Available Reports Report Controls Report Content View archived report or perform live run on current data
Available OLAP Cubes OLAP Reporting Ah-hoc OLAP Reporting Environment Available dimensions Available measures