Download

1 / 37
380 likes | 497 Views
This paper by Andrew B. Kahng and Stefanus Mantik focuses on improving semiconductor design productivity through an innovative METRICS framework. It addresses the rising costs associated with engineering and EDA tools, emphasizing the need for standardized metrics to evaluate design processes. The framework aims to facilitate data collection and analysis to identify best practices and optimize design strategies. It also highlights current gaps in metrics consistency and availability, advocating for a robust infrastructure to support continuous improvement within the semiconductor industry.

E N D
Design Cost Modeling and Data Collection Infrastructure Andrew B. Kahng and Stefanus Mantik* UCSD CSE and ECE Departments (*) Cadence Design Systems, Inc. http://vlsicad.ucsd.edu/
ITRS Design Cost Model • Engineer cost/year increases 5% / year ($181,568 in 1990) • EDA tool cost/year (per engineer) increases 3.9% / year • Productivity due to 8 major Design Technology innovations • RTL methodology • … • Large-block reuse • IC implementation suite • Intelligent testbench • Electronic System-level methodology • Matched up against SOC-LP PDA content: • SOC-LP PDA design cost = $20M in 2003 • Would have been $630M without EDA innovations
Outline • Introduction and motivations • METRICS system architecture • Design quality metrics and tool quality metrics • Applications of the METRICS system • Issues and conclusions
Motivations • How do we improve design productivity ? • Is our design technology / capability better than last year? • How do we formally capture best known methods, and how do we identify them in the first place ? • Does our design environment support continuous improvement, exploratory what-if design, early predictions of success / failure, ...? • Currently, no standards or infrastructure for measuring and recording the semiconductor design process • Can benefit project management • accurate resource prediction at any point in design cycle • accurate project post-mortems • Can benefit tool R&D • feedback on tool usage and parameters used • improved benchmarking
Fundamental Gaps • Data to be measured is not available • Data is only available through tool log files • Metrics naming and semantics are not consistent among different tools • We do not always know what data should be measured • Some metrics are less obviously useful • Other metrics are almost impossible to discern
Purpose of METRICS • Standard infrastructure for the collection and the storage of design process information • Standard list of design metrics and process metrics • Analyses and reports that are useful for design process optimization METRICS allows: Collect, Data-Mine, Measure, Diagnose, then Improve
Outline • Introduction and motivations • METRICS system architecture • Components of METRICS System • Flow tracking • METRICS Standard • Design quality metrics and tool quality metrics • Applications of the METRICS system • Issues and conclusions
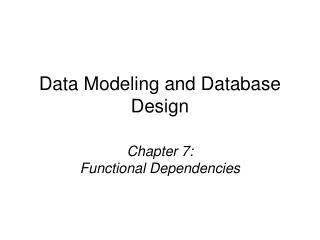
Tool Tool Transmitter Java Applets wrapper Tool API Transmitter Transmitter XML Inter/Intra-net Web Server Data Mining DB Reporting Metrics Data Warehouse METRICS System Architecture DAC00
Receiver Servlet Reporting Servlet Input Form METRICS Server Internet/Intranet Dataminer Data translator Apache + Servlet Receiver External Interface Reporting DB Decryptor Java Beans JDBC XML Parser
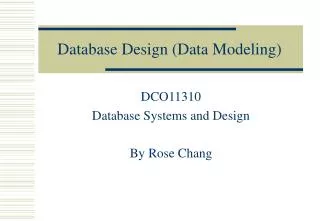
nexus12 2% nexus11 2% nexus10 1% synthesis 20% ATPG 22% postSyntTA 13% BA 8% nexus4 95% funcSim 7% placedTA 7% physical 18% LVS 5% % aborted per machine % aborted per task Example Reports CPU_TIME = 12 + 0.027 NUM_CELLS Correlation = 0.93
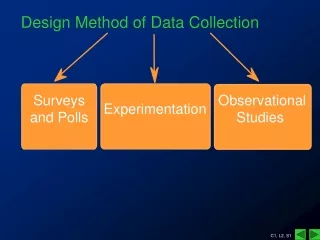
S T1 T1 T1 T2 T2 T2 T2 T3 T3 T3 T4 T4 F Flow Tracking Task sequence: T1, T2, T1, T2, T3, T3, T3, T4, T2, T1, T2, T4
Synthesis & Tech Map QP Capo Placer DEF Placed DEF Incr. LEF GCF,TLF Pre-placement Opt Post-placement Opt CTGen QP ECO Clocked DEF Constraints Optimized DEF QP QP Opt WRoute Routed DEF Ambit PKS WRoute GRoute WRoute Incr WRoute Pearl CongestionAnalysis Testbeds: Metricized P&R Flow M E T R I C S DEF Placed DEF LEF Legal DEF UCLA + Cadence flow Congestion Map Routed DEF Final DEF Cadence PKS flow Cadence SLC flow
METRICS Standards • Standard metrics naming across tools • same name «same meaning, independent of tool supplier • generic metrics and tool-specific metrics • no more ad hoc, incomparable log files • Standard schema for metrics database • Standard middleware for database interface
Generic and Specific Tool Metrics Partial list of metrics now being collected in Oracle8i
Open Source Architecture • METRICS components are industry standards • e.g., Oracle 8i, Java servlets, XML, Apache web server, PERL/TCL scripts, etc. • Custom generated codes for wrappers and APIs are publicly available • collaboration in development of wrappers and APIs • porting to different operating systems • Codes are available at: http://www.gigascale.org/metrics
Outline • Introduction and motivations • METRICS system architecture • Design quality metrics and tool quality metrics • Applications of the METRICS system • Issues and conclusions
Tool Quality Metric: Behavior in the Presence of Input Noise [ISQED02] • Goal: tool predictability • Ideal scenario: can predict final solution quality even before running the tool • Requires understanding of tool behavior • Heuristic nature of tool: predicting results is difficult • Lower bound on prediction accuracy: inherent tool noise • Input noise "insignificant" variations in input data (sorting, scaling, naming, ...) that can nevertheless affect solution quality • Goal: understand how tools behave in presence of noise, and possibly exploit inherent tool noise
Quality Quality Parameter Parameter Monotone Behavior • Monotonicity • monotone solutions w.r.t. inputs
Monotonicity Studies • OptimizationLevel: 1(fast/worst) … 10(slow/best) • Note: OptimizationLevel is the tool's own knob for "effort"; it may or may not be well-conceived with respect to the underlying heuristics (bottom line is that the tool behavior is "non-monotone" from user viewpoint)
Noise Studies: Random Seeds • 200 runs with different random seeds • ½-percent spread in solution quality due to random seed -0.05%
Noise: Random Ordering & Naming • Data sorting no effect on reordering • Five naming perturbation • random cell names without hierarchy (CR) • E.g., AFDX|CTRL|AX239 CELL00134 • random net names without hierarchy (NR) • random cell names with hierarchy (CH) • E.g., AFDX|CTRL|AX129 ID012|ID79|ID216 • random net names with hierarchy (NH) • random master cell names (MC) • E.g., NAND3X4 MCELL0123
Noise: Random Naming (contd.) • Wide range of variations (±3%) • Hierarchy matters Number of Runs % Quality Loss
Noise: Hierarchy • Swap hierarchy • AA|BB|C03 XX|YY|C03 • XX|YY|Z12 AA|BB|Z12 Number of Runs % Quality Loss
Outline • Introduction and motivations • METRICS system architecture • Design quality and tool quality • Applications of the METRICS system • Issues and conclusions
Categories of Collected Data • Design instances and design parameters • attributes and metrics of the design instances • e.g., number of gates, target clock frequency, number of metal layers, etc. • CAD tools and invocation options • list of tools and user options that are available • e.g., tool version, optimism level, timing driven option, etc. • Design solutions and result qualities • qualities of the solutions obtained from given tools and design instances • e.g., number of timing violations, total tool runtime, layout area, etc.
Three Basic Application Types • Design instances and design parameters • CAD tools and invocation options • Design solutions and result qualities • Given and , estimate the expected quality of • e.g., runtime predictions, wirelength estimations, etc. • Given and , find the appropriate setting of • e.g., best value for a specific option, etc. • Given and , identify the subspace of that is “doable” for the tool • e.g., category of designs that are suitable for the given tools, etc.
Estimation of QP CPU and Wirelength • Goal: • Estimate QPlace runtime for CPU budgeting and block partition • Estimate placement quality (total wirelength) • Collect QPlace metrics from 2000+ regression logfiles • Use data mining (Cubist 1.07) to classify and predict, e.g.: • Rule 1: [101 cases, mean 334.3, range 64 to 3881, est err 276.3] if ROW_UTILIZATION <= 76.15 then CPU_TIME = -249 + 6.7 ROW_UTILIZATION + 55 NUM_ROUTING_LAYER - 14 NUM_LAYER • Rule 2: [168 cases, mean 365.7, range 20 to 5352, est err 281.6] if NUM_ROUTING_LAYER <= 4 then CPU_TIME = -1153 + 192 NUM_ROUTING_LAYER + 12.9 ROW_UTILIZATION - 49 NUM_LAYER • Rule 3: [161 cases, mean 795.8, range 126 to 1509, est err 1069.4] if NUM_ROUTING_LAYER > 4 and ROW_UTILIZATION > 76.15 then CPU_TIME = -33 + 8.2 ROW_UTILIZATION + 55 NUM_ROUTING_LAYER - 14 NUM_LAYER • Data mining limitation sparseness of data
Clustering Refinement Optimization of Incremental Multilevel FM Partitioning • Motivation: Incremental Netlist Partitioning • Scenario: Design changes (netlist ECOs) are made, but we want the top-down placement result to remain similar to previous result
Optimization of Incremental Multilevel FM Partitioning • Motivation: Incremental Netlist Partitioning • Scenario: Design changes (netlist ECOs) are made, but we want the top-down placement result to remain similar to previous result • Good approach [CaldwellKM00]: “V-cycling” based multilevel Fiduccia-Mattheyses • Our goal: What is the best tuning of the approach for a given instance? • break up the ECO perturbation into multiple smaller perturbations? • #starts of the partitioner? • within a specified CPU budget?
... T1 T2 T3 Tn S F Optimization of Incremental Multilevel FM Partitioning (contd.) • Given: initial partitioning solution, CPU budget and instance perturbation (I) • Find: number of stages of incremental partitioning (i.e., how to break up I ) and number of starts • Ti = incremental multilevel FM partitioning • Self-loop multistart • n number of breakups (I = 1 + 2 + 3 + ... + n)
Flow Optimization Results • If (27401 < num edges 34826) and (143.09 < cpu time 165.28) and (perturbation delta 0.1) then num_inc_stages = 4 and num_starts = 3 • If (27401 < num edges 34826) and (85.27 < cpu time 143.09) and (perturbation delta 0.1) then num_inc_stages = 2 and num_starts = 1 • ... Up to 10% cutsize reduction with same CPU budget, using tuned #starts, #stages, etc. in ML FM
Outline • Introduction and motivations • METRICS system architecture • Design quality and tool quality • Applications for METRICS system • Issues and conclusions
METRICS Deployment and Adoption • Security: proprietary and confidential information cannot pass across company firewall may be difficult to develop metrics and predictors across multiple companies • Standardization: flow, terminology, data management • Social: “big brother”, collection of social metrics • Data cleanup: obsolete designs, old methodology, old tools • Data availability with standards: log files, API, or somewhere in between? • “Design Factories” are using METRICS
Conclusions • METRICS System : automatic data collection and real-time reporting • New design and process metrics with standard naming • Analysis of EDA tool quality in presence of input noise • Applications of METRICS: tool solution quality estimator (e.g., placement) and instance-specific tool parameter tuning (e.g., incremental partitioner) • Ongoing works: • Construct active feedback from METRICS to design process for automated process improvement • Expand the current metrics list to include enterprise metrics (e.g., number of engineers, number of spec revisions, etc.)