Download
1 / 25
250 likes | 365 Views
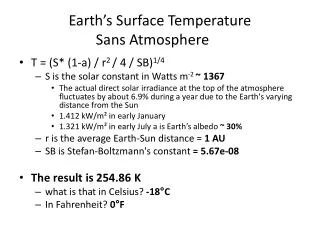
Lesson Learned from CCSP 1.1 Temperature Trends in the Atmosphere. OUTLINE Reducing Structural Error Better use of existing data Multiple analysis teams Multiple observing systems Data Homogeneity GCOS principles Benchmark or Reference Observing Systems

E N D
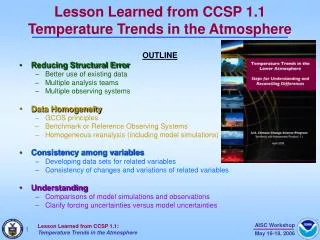
Lesson Learned from CCSP 1.1Temperature Trends in the Atmosphere OUTLINE • Reducing Structural Error • Better use of existing data • Multiple analysis teams • Multiple observing systems • Data Homogeneity • GCOS principles • Benchmark or Reference Observing Systems • Homogeneous reanalysis (including model simulations) • Consistency among variables • Developing data sets for related variables • Consistency of changes and variations of related variables • Understanding • Comparisons of model simulations and observations • Clarify forcing uncertainties versus model uncertainties
COA Program Description CCSP 1.1 Recommendation for Improved Climate Data Records and Understanding of Climate 2
Reducing Structural Error • Better use of existing data • Multiple analysis teams • Multiple observing systems
Reducing Structural Error New Sonde data sets (Free et. al. and Thorne et. al.) New version (Mears & Wentz) Corrected Data Set (Christy & Spencer) Addressed stratospheric influence in derivation of tropospheric temperature (Fu et. al.) New data set (Vinnikov et. al.) - 20 New model simulations with many ensemble numbers prepared for IPCC (2007)
TROPICS Reducing Structural Error Temperature Trends for 1979-2004 (oC/decade) by Latitude R=RSS A=UAH U=HadAT2 M=UMd P=RATPAC N=NOAA T4: Lower Stratosphere T2: Mid Troposphere to Lower Stratosphere T2LT: Lower Troposphere TS: Surface
Reducing Structural Error Annual Ship - Buoy Bias Ship-Buoy SST Zonal Biases • Buoy SSTs increase with time • Significant buoy obs 1994 to present • Care required to first correct in situ biases then satellite biases
Data Homogeneity • GCOS principles • Benchmark or Reference Observing Systems • Homogeneous reanalysis (including model simulations)
Data Homogeneity Climate Observing System Adherence to Ten Principles for satellite observations • 1. Constant diurnal cycle sampling • 2. Suitable overlaps • 3. Continuity • 4. Pre-launch calibration • 5. On-board calibration • The international framework for sharing data is vital. 6. Operational production 7. Data Systems 8. Maintain baseline instruments 9. Complementary in-situ 10. Identify random and time- dependent errors
Data Homogeneity Climate Observing System Adherence to Ten Principles for surface-based observations • 1. Management of Network Change • 2. Parallel Testing • 3. Metadata • 4. Data Quality and Continuity • 5. Environmental Assessments • The international framework for sharing data is vital. 6. Historical Significance 7. Complementary Data 8. Climate Requirements 9. Continuity of Purpose 10. Data and Metadata Access
Data Homogeneity Baseline Surface Reference Networks (BSRN) Current Proposed SEBN 10
Data Homogeneity Validation of NASA EOS satellite-based downwelling infrared and solar estimates Baseline Surface Reference Networks (BSRN) (from NASA/CAVE web site)
Data Homogeneity Baseline Surface Reference Networks (BSRN) For clear sky conditions, 17 Jan. 2003 Example calibration issue
Data HomogeneityReference Networks Chilean Tsunami Buoy being Deployed during a U.S. Climate mission NOAA Contributions Future NOAA Deploying and maintaining 89 Ocean Reference Stations (42 now in service) 13
Data Homogeneity U.S. Climate Reference Network Asheville, NC Horticultural Crops Res. Ctr.
USCRN Network May, 2006 U.S. Climate Reference Network 15
USCRN Stations Outside of Contiguous Lower - 48 States USCRN Alaska Locations Single sites installed at end FY 05 (2): Pt. Barrow & Fairbanks GCOS single sites installed: FY 05 (2): Sitka & St. Paul Island Currently deployed: • Alaska – 4 (Barrow, Fairbanks, Sitka, St. Paul) • Hawaii - 2 (Mauna Loa & Waiakea, Big Island) Pending deployment: • America Samoa (Sept 2006) USCRN Hawaiian Locations Single sites installed at end FY 05 (2): Mauna Loa Summit, and Waiakea
Data Homogeneity Reanalysis and Observed Simulation Experiments • Daily historic Troposphere reanalysis from surface pressure observations • Example: “post-Christmas Snowstorm” of Dec. 1947 (Arrows point to same 500 hPa features) Original 1947 Air Weather Service Analysis Reanalysis: Surface Pressure & Ensemble Filter Reanalysis: Full NCEP Assimilation System • Data assimilation system using only sfc pressure data • Could produce a reanalysis of daily extratropical circulation from the late 19th century to present. • International Surface Pressure Data Bank • 21,702 land and marine stations 17
Consistency Among Variables • Developing data sets for related variables • Consistency of changes and variations of related variables
Consistency Among Variables Trends in Vapor 1958-2001 Trend: 0.45 mm/decade from ERA-40 (Model) 1988-2001 Trend: 0.53 mm/decade (ERA-40) 0.51 mm/decade (SSMI) from SSMI (Satellite) From Wentz (2005)
Consistency Among Variables Contributes to Annual TotalHeavy Precip Days (>95th percentile) Daily Intensity(Total Annual Precip / # of Days with Precip) Alexander et al. (2005)
Understanding • Comparisons of model simulations and observations • Clarify forcing uncertainties versus model uncertainties
Understanding The Relationships Between Tropical Temperature Changes at Earth’s Surface and in Two Different Layers of the Troposphere Observations Observations Observations Observations
Understanding Modeled and Observed Global-Average Temperature Trends Modeled and Observed Temperature Trends in the Tropics (20oS-20oN) 23
Understanding Data Access to Models & ObservationsIntercomparison: Weather Models & Observational record • Display of upper-air in-situ data and NCEP North America Regional Reanalysis Model • Analysis can improves both models and observations: • Model background provide QC for observational records • Observations can provide improvements to models
COA Program Description CCSP 1.1 Recommendation for Improved Climate Data Records and Understanding of Climate 25