International Benchmarking Feasibility Study Findings
240 likes | 501 Views
International Benchmarking Feasibility Study Findings. Presentation to the International Conference on Institutional Taxation Analysis. H.M. Treasury 21 September 2009. Agenda. Background Methodology Summary of Findings Key Success Factors. Background Methodology Summary of Findings

International Benchmarking Feasibility Study Findings
E N D
Presentation Transcript
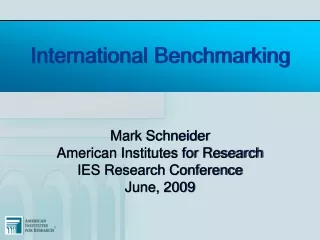
International Benchmarking Feasibility Study Findings Presentation to the International Conference on Institutional Taxation Analysis H.M. Treasury 21 September 2009
Agenda • Background • Methodology • Summary of Findings • Key Success Factors
Background • Methodology • Summary of Findings • Key Success Factors
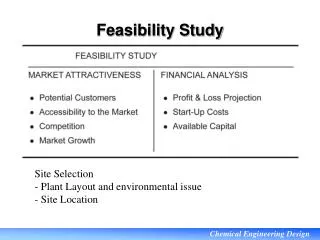
Background to the Feasibility Study Aims and Objectives Selecting ITO Partners And Benchmarks • To test the feasibility of the benchmark approach adopted and whether the approach delivers valuable and ‘actionable’ insights • To identify targeted opportunities for efficiency and performance improvement based on comparison of cost and other performance indicators across a group of peer tax departments • Two benchmark partners were invited to participate in this feasibility study: • Australian Taxation Office (ATO) • South African Revenue Service (SARS) • Criteria for identifying the eight benchmarks selected: • Relative consistency across tax administrations • Valuable indicator of performance against business objectives • Data is readily available now or similar data is available
The eight benchmarks selected related to different process areas, tax products and customer groups High-Level Tax Process with Related Benchmarks Customer Contact, Education & Enablement Registration & Account Maintenance Processing of Returns & Payments Compliance & Debt Management 1 5 3 6 Cost of Call Centres Cost of VAT Registrations Cost of Returns Processing Time to Resolve Complex Technical Issues 2 4 7 Quality of Call Centres Time of Returns Processing Cost of Risk Management 8 Cost of Audits
The eight benchmarks selected related to different process areas, tax products and customer groups
Background • Methodology • Summary of Findings • Key Success Factors
The methodology was based on a three step iterative process that involved precise description of scope and data availability Scope of Project 2 1 2 3 Create the Benchmark Tools and Templates Establish Benchmark Scope and Definition Complete Pilot Benchmarks Next Steps • Define the core Tax Collection processes • Define standard terms and create the data dictionary • Conduct alignment/ initial information gathering interviews and workshops with Revenue Departments • Collect sample data • Develop the questions and templates to collect data • Create benchmark database of metrics per core process • Prepare preliminary reports based on sample data • Remaining benchmarks • Gather data • Assign to pre-defined activity segments • Harmonise data; ensure comparable across countries • Index harmonised data by relevant driver • Prepare initial output reports • Initiate improvement activities based on evaluation of benchmarking results
Data was harmonised in order to enable meaningful comparisons between countries Harmonisation Factor: Purchasing Power Parity Normalisation Factor: Scale normalisation through averages, e.g. dividing by number of call minutes Meaningful comparisons between participants are possible, independent of scale and economic factors
Continual contact provided a rich understanding of cost drivers, context, and performance improvement areas • Each benchmark comparison was analysed to explain the differences in performance between the three countries • Contextual and qualitative understanding formed a central part of the analysis • The analysis was validated with internal stakeholders in each country before being finalised • Opportunities for performance improvement were identified
Background • Methodology • Summary of Findings • Key Success Factors
Summary of performance variance There is significant variation in efficiency, effectiveness and service quality across benchmarked tax authorities indicating substantial potential to enhance tax operations and yield through application of benchmarked best practices Capture costs and exception handling costs are primary drivers of processing cost differences. Achieving best practice levels in income tax returns processing could deliver over 60% cost saving(1) Integration of customer information to create a single view of the customer, such as ATO’s single business number, has significant impact on operations cost and service quality Proactive use of information from multiple sources could reduce compliance risk and operations cost in GST/VAT registration1 alone by ca. 70% Proactive demand management can have a substantial impact on efficiency and effectiveness of operations, for example by eliminating avoidable contact Focus on matching resource to demand and driving utilisation efficiency represents a significant cost and service opportunity e.g. over 25% cost saving in contact centres1 Increasing focus on high risk/value cases in case selection and audit could at a minimum double the yield per risk-based audit Notes: (1) Average of benchmarked authorities compared with best performer
Benchmark1: Cost of Call Centres The benchmark dashboard is the key high-level output of the tax model and comprises a number of RAG-coded boxes Example Dashboard Overall By Representation By Function N/A
Benchmark 1 & 2: Cost and Quality of Contact Centres Description • Telephone contact is increasingly the channel of choice for citizens • Public service challenges related to spiralling and variable demand, balancing pressures for reduced expenditure and improved service • The benchmark examines cost and quality of tax call centres in respect of GST / VAT and Individual and Company Income Tax
Benchmark 1 & 2: Cost and Quality of Contact Centres Analysis Figure 3 - Cost per Call Minute (Int. $) Figure 1 - Cost per Call (Int. $) Figure 2 -Average call handling time (mins) Figure 4 – Advisor Utilisation (Call Time / Total Time) SARS HMRC ATO HMRC SARS ATO Figure 5 - Average Speed to Answer (Mins) ATO HMRC SARS
Benchmark 1 & 2: Cost and Quality of Contact Centres Opportunities • Capacity management – better alignment of capacity to variable demand • Temporary / flexible workforce and career path planning • Invest in direct staff engagement • Call guidance – increase flexibility • Absenteeism management • Demand management activity – increasing in the participating organisations, but could be accelerated, particularly in HMRC • Determine drivers of contact and systematically manage down avoidable contact e.g. self-service solutions, in order to improve contact resolution • Revise queues and systems to match customer segments • Customer service / Cost • Trade-off between service level expectations and utilisation of staff
Benchmark 3 & 4: Cost and Time of Processing Individuals’ Self-Assessment Returns Description • Self-assessment is the method by which customers reconcile their annual tax position • The purpose is to account for and pay any additional tax due, or to receive a rebate where tax has been over-paid • Two benchmarks relate to this process: the cost of processing self-assessment returned filed by individuals, and the time required to do so
Benchmark 3 & 4: Cost and Time of Processing Individuals’ Self-Assessment Returns Analysis Figure 1: Average processing cost per return (Int. $) Figure 2: Average elapsed days to process 10.7 45 HMRC ATO SARS
Benchmark 3 & 4: Cost and Time of Processing Individuals’ Self-Assessment Returns Analysis Figure 3: Participants’ Returns by Channel Figure 4: Average Cost per Return per Channel (Int $). Figure 5: Annual Volume of Returns Processed per Direct FTE SARS ATO HMRC
Benchmark 3 & 4: Cost and Time of Processing Individuals’ Self-Assessment Returns Opportunities • Demand management • Collaborate with practitioners to help reduce submission peak • Accelerate migration to electronic channels • Increase use of auto-validation and pre-population to reduce errors and exceptions • Capacity management • Invest in training and change procedures to facilitate a temporary resource pool and multi-skilled staff • Customer service • Measuring and publishing elapsed times for returns processing • Encourage customer utilisation of practitioners to lower exception rates in the paper channel. • Continue to review opportunities to reduce form complexity
Background • Methodology • Summary of Findings • Key Success Factors
Key success factors • Close involvement of internal stakeholders was critical to the success of the benchmarking • 3 stakeholder groups: Commissioner & Senior Directors, Process and Data Experts, Analytical ‘Quality Assurance’ • All stakeholders were involved in ongoing validation throughout the study through interviews, discussions and workshops • This level of involvement made it possible to move beyond static data comparisons in order to identify opportunities for performance improvement • Data formats were developed based primarily on understanding what data sets and structures were already available – iterative process and essential to avoid benchmarking becoming a ‘cottage industry’ • Benchmark analysis must make meaningful and useful comparisons • Essential to have detailed discussion at the outset to define scope, along with associated activities, tasks and metrics in standard terms that can be applied across tax organisations • The qualitative information built up through ongoing, iterative contact provided rich explanation of the differences between the countries, the possible cost drivers and performance improvement areas • Critical to ensure ongoing communication and sharing of best practice across participating organisation
Collaboration environments can be valuable tools – if sufficient time can be invested Example Conversation