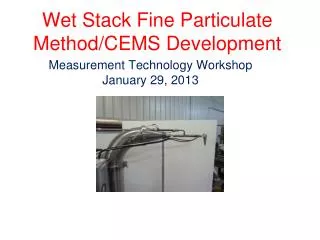
Wet Stack Fine Particulate Method/CEMS Development
Wet Stack Fine Particulate Method/CEMS Development. Measurement Technology Workshop January 29, 2013. Presentation Topics. Review of project objectives Why monodisperse (MD) test the IDS? Test apparatus set up and protocol Initial MD test results

Wet Stack Fine Particulate Method/CEMS Development
E N D
Presentation Transcript
Wet Stack Fine Particulate Method/CEMS Development Measurement Technology Workshop January 29, 2013
Presentation Topics • Review of project objectives • Why monodisperse (MD) test the IDS? • Test apparatus set up and protocol • Initial MD test results • Computational Fluid Dynamics (CFD) modeling of IDS & design modifications • MD test results for modified IDS (version 5) • Plans for next steps
Project Objective Overall goal is development of a method and CEMS for measurement of PM 2.5 under wet, super saturated stack conditions.
Why Monodisperse Test The IDS? • Polydisperse aerosol tests conducted using the Baldwin Environmental wet-stack simulator: • Provided indication of IDS separation performance • Lacked desired precision regarding cut point & collection efficiency at key particle size(s)
Monodisperse Test Description at University of Minnesota • Determine IDS sample collection efficiency of various sized liquid aerosols up to 15 um; • Plot collection efficiency curves; • Determine the D50 particle size; • Verify sample collection efficiency vs. sample loss
Monodisperse Droplet Test Protocol (cont.) • Test medium: Fluorescent dye oleic acid • Use VOAG (Vibrating Orifice Aerosol Generator) to generate known mono-dispersed droplets,verifiedby an Aerodynamic Particle Sizer (APS) . • Conduct IDS test runs within a 6” duct, at 20m/s velocity, ambient temperature, pressure, and relative humidity. • Confirm a flat velocity profile at the sample point, perform a velocity profile before and after each test. • Conduct three (3) test runs at each droplet size. • Record fluorometer readings of sample fractions.
Original IDS Monodisperse Collection Efficiency Test Results Isokinetic Filter/Active Filter Isokinetic Filter Isokinetic Filter
Empirical Test Conclusion Directed Us Back to the Drawing Board • Lower cone losses unacceptable. • Something wrong with cone angle? • Is velocity at sample zone critical? • Did not meet target performance: • D50 at 12um or better • Sampling Efficiency at 5um >90% • Need to computer model the IDS for maximum performance
Using Fluent Software, Computer3-D Model of the Original IDS: 20 m/s Stack Velocity, 16o Nozzle Cone Angle, 0.192” Inlet Nozzle Sample Zone 31.8 mm diameter Cap 0.290” Outlet Nozzle 5 LPM Sample Pull
CFD of Original IDS 3-D Velocity Field This plot shows the velocity contours along the cross section bisecting the IDS. The strangest part of the flow-field shows an acceleration away from the sampling inlet. Mass balance is maintained, and the sampling rate of 5 lpm has been verified. The unintuitive flow potentially appears as a result of anisotropic pressure gradients in the IDS exit flow.
3-D IDS Velocity Vectors This plot shows the velocity vector field along the cross section bisecting the original IDS. There is a counter-clockwise flow around the red circle! Further exploration of the results using a transient state model did NOT show this circulation significantly oscillating nor dispersing. This could explain the low collection efficiencies of the original IDS during the wet stack simulations.
The Modeled V5 IDS IDS Nozzle Inlet Diameter: 4.52 mm (0.178 in.) Nozzle Cone Angle: 12° Nozzle Extension Length: 19.05 mm (3/4 in.) Sample Zone Diameter: 19.05 mm (3/4 in.) Sample Zone Length: 28.58 mm (9/8 in.) IDS Thickness at Sample Zone: 4 mm (0.157 in.) IDS Cap Outlet Diameter: 5.44 mm (0.214 in.) Cap Cone Angle: 90° Cap Extension Length: 25.4 mm (1.0 in.) Sample Pipe ID: 9.525 mm (3/8 in.) Sample Pipe OD: 11.125 mm (7/16 in.) IDS Length ~ 150 mm (5.9 in.) IDS Width ~ 27.05mm (1.05 in.)
Monodisperse Collection EfficiencyStreamlined IDS Test Results
Calculation of Droplet Diameter • Calculated droplet diameter (dd) resulting in 2.5 um particle (aerodynamic) from scrubber water solids concentration data • Equation presented in a project development plan (Leith, UNC-Chapel Hill, August 2007) • Calculated from median solids (TDS +TSS) concentration: dd = 4.3 um • dd calculated from individual solids concentrations, TDS +TSS, (excluding 1 facilities data as an outlier) : mean = 4.0 um range: 2.4 to 6.8 um • dd calculated from individual solids concentrations, TDS only (excluding 1 facilities data as an outlier) : mean = 7.2 um range: 2.8 to 12.8 um
Calculated Droplet Diameter, dd, from Solids Concentration Resulting in 2.5 um Particle
Conclusions • Redesign of IDS significantly improved performance • Improved design falls short of original criterion: 90%+ efficiency @ 10 um • Actual performance achieved: • 88% efficiency at 5 um • 61% efficiency at 10 um • Scrubber water solids concentration data and calculations indicate performance at 5um aerosol may be sufficient to capture 2.5 um particles
WHAT ARE THE NEXT STEPS? • More modeling to improve IDS design • Reconstruct Sampler with new design • Monodisperse aerosol test of final modified IDS • Field trial of full sampler at a power plant (China?) with wet scrubber installation to determine proof of concept • Precision test entire system • Propose Method