Download
1 / 13
130 likes | 254 Views
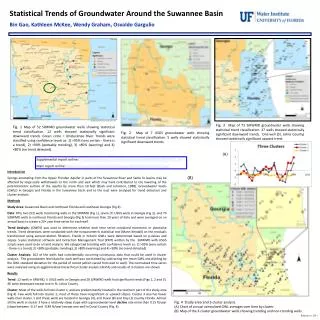
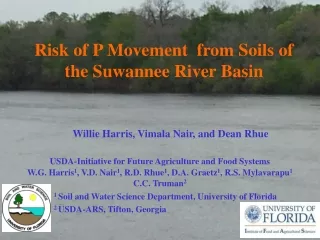
Risk of P Movement from Soils of the Suwannee River Basin. Willie Harris, Vimala Nair, and Dean Rhue. W.G. Harris 1 , V.D. Nair 1 , R.D. Rhue 1 , D.A. Graetz 1 , R.S. Mylavarapu 1 C.C. Truman 2. USDA-Initiative for Future Agriculture and Food Systems.

E N D
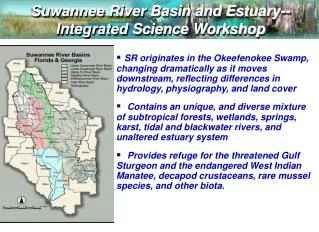
Risk of P Movement from Soils of the Suwannee River Basin Willie Harris, Vimala Nair, and Dean Rhue W.G. Harris1, V.D. Nair1, R.D. Rhue1, D.A. Graetz1, R.S. Mylavarapu1 C.C. Truman2 USDA-Initiative for Future Agriculture and Food Systems 1 Soil and Water Science Department, University of Florida 2 USDA-ARS, Tifton, Georgia
Topics • Hydrology – Soils –P (& N) Transport • Predicting Vertical P Movement in Soils
Drainage: Surface vs. SubsurfaceLower Suwannee Basin 30 km Important factor in potential P transport
Surface Drainage of “Flatwoods”(“Surface” entails some shallow subsurface flow in E horizon, which is minimally retentive of P) Runoff: High Erosion: Low Leaching: Low Denitrification: High P loss risk: High Spodosol E 2 m Bh Aquitard
Subsurface Drainage (Karst)(Flow in soil zone mainly vertical) Entisol Ultisol P loss risk: Variable E E Runoff: Low Erosion: Low Leaching: Variable Denitrification: Low Bt 10 m
Sand grain coatings, their presence or absence, makes a big difference in P retention capacity
Toward a More Quantitative Site Specific Assessment of Leaching Potential • Capacity Approach • What is the remaining capacity? • Retardation Approach • How many “pore volumes” before “breakthrough” of elevated P concentrations at a given depth.
Calculated Remaining P Sorption Capacity vs. P Concentrations in Porewater Remaining “Safe P Storage Capacity” for sandy soils- SPSC (PSR0 – Soil PSR)(Oxalate Fe + Al)
“Safe” P Storage Capacity (mg kg-1) -20 0 20 40 60 -60 -40 -20 0 20 2 m Minimally-impacted dairy Heavily-impacted dairy
Modeling P Retardation:RPA = “Relative P Adsorption Capacity”
Leaching Assessment Approaches are Complementary Retardation Approach Capacity Approach Captures previous loading effect? Yes Not well Captures time factor? Indirectly Yes Works for naturally phosphatic soils? No Yes
Summary of Findings, to Date • Predicted vs. observed P movement - reasonably close. • Typical “safe lifespan” of application site - a few years*. • Phosphate effects realized later than nitrate effects. (BUT …) • Phosphate effects realized longer than nitrate effects. *A loamy horizon (Bt) could extend this greatly, barring preferential flow.
Acknowledgements • Technical staff: Bill Reve, Greg Means,Dawn Lucas,Keith Hollien • Members of the Florida P-Index Committee. • Graduate student: Myrlene Chrystostome, Omar Harvey, Daniel Herrera, Rav Ramnarine, Leighton Walker