Download
1 / 21
210 likes | 326 Views
Explore the complex geodynamics of the Northern Apennines with seismic analysis techniques, revealing insights into crustal thickness, lithosphere properties, and subduction processes in the region.

E N D
SlabImaging in Continental Subduction under the NorthernApennines Bianchi I.1,2, J.J. Park3, T. Mayeau3, N. Piana Agostinetti2, V. Levin4 1Universita’ “La Sapienza” di Roma 2 INGV Roma 3 Yale University, CT 4RutgersUniversity, NJ Thanks to members of the RETREAT project seismology team
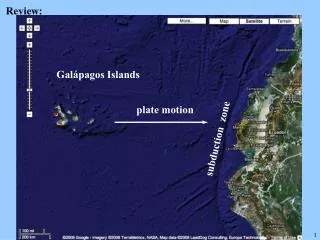
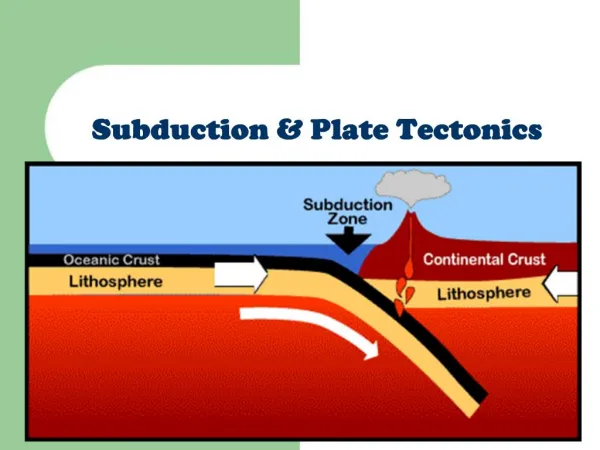
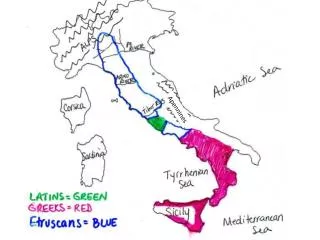
APENNINES MARK A SUBDUCTION ZONE Italian peninsula is almost parallel to the convergence direction between Africa and Eurasia. There is considerable earthquake activity along the Apennines BUT Earthquakes are concentrated beneath the mountains and descend to the depth of ~ 100 km. ApenninesSlab Lucente et al., 1999 (Piana Agostinetti et al, 2008) Much more slab is imaged and caused by 30 My long subduction. Vertical transect
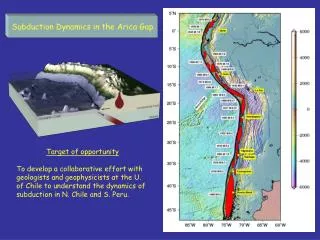
An eastward retreating slab has been invoked as principal driving process in this area, able to describe the present position of the orogen and to justify the juxtaposing of extension over compression. (Malinverno & Ryan 1986) Adriatic Sea (Adriamicroplate) Surface convergence Surface extension Tyrrhenian Sea (back-arc basin) Adapted from Faccenna et al., 2004
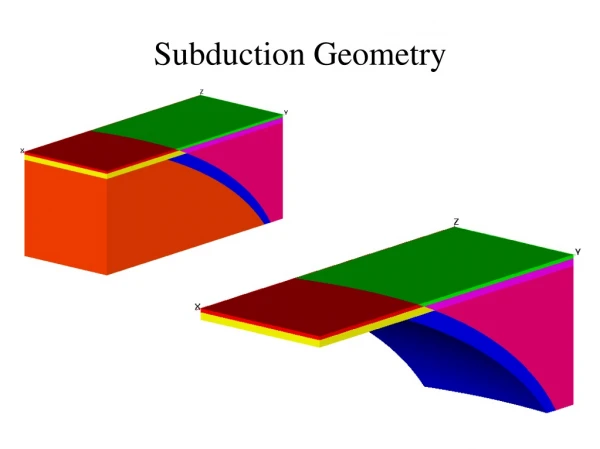
Conceptual Tectonic Model for RETREAT (Brandon, Willett, Pazzaglia, et al) Important Aspects: Crust thickens and thins while passing through orogen Rigid mantle block beneath orogen to match surface tectonics in geodynamic model ADRIA Plate (Africa) TYRRHENIAN Plate (Europe) GRAZIE SLAB Retreat Things to look for with Seismology: Crustal Thickness Top of the Downgoing Lithosphere
Crustal Wavespeeds (Vp & Vs) Crustal Models Finetti et al., 2001
Test for Crustal Thickness I: surface-wave phase velocity 3-station wavelet-based cross-correlation, obtains both apparent phase velocity and propagation azimuth Vertical motion Correlation measure (white is good) Phase velocity (km/sec) RETREAT Seismic Array Wavelet transform Propagation azimuth
Match the locations of station triangles to a coarse grid of RETREAT Field Area Compute median phase-velocity, discarding values >6 km/sec or <1.5 km/sec ADRIA Phase velocity (km/sec) GRAZIE TYRRHENIAN Surface Wave period (seconds)
Faster phase-velocity at ~20s period in Tuscany, suggestive of thinner crust there GRAZIE
Retreat seismic array Test of Crustal Thickness II: Receiver Function Transect Closely-spaced station transect Epicentraldistribution ofteleseismsM > 5.5 12659 teleseismic seismicrecordsused
Receiver Functions overview Three components: DV(t) = I(t)*S(t)*EV(t) DR(t) = I(t)*S(t)*ER(t) DT(t) = I(t)*S(t)*ET(t) ER(ω)=DR(ω)/DV(ω) ET(ω)=DT(ω)/DV(ω) (Ammon, 1997)
Earthquakes From NE Tuscan Moho Adriatic Moho? Earthquakes From SW Tuscan Moho Wrong Polarity! Piana Agostinettiet al, EPSL in press 2008
Back-azimuth RF DependenceimpliesbothRadial & Transverse RF amplitudeandimplies interface dip or anisotropy Energy on bothR and Tcomponents Energy only on Rcomponent
How to evaluate both radial & transverse RFs? Enhance Ps pulses that can be explained in terms of dipping interface or anisotropy π/2 Shift 0 By Katsuhiko SHIOMI
Analysis Procedure: 1-Defineeeachprofilefromspots 10 km apart 2- Finding the piercing point at 40 km depthofevery RF collected. 3- Every spot grabsRFsforwhich 40-km piercing points are in Immediatelysurroundingarea. 4- Applyingthe Harmonicexpansion and migrationfocusing at 40-km depth. AA’: spotsgrab piercing pointsinto a 20x120 km area. BB’: spotsgrab piercing pointsinto a 20x80 km area. CC’: spotsgrab piercing pointsinto a 20x120 km area. DD’: spotsgrab piercing pointsinto a 20x40 km area. EE’: spotsgrab piercing pointsinto a 20x120 km area.
RESULTS 0 130 km (at least 300 RFstobuildonewiggle)
0 240 km
0 210 km
Attempttofitobservationswithsimpledippingisotropic interface: The continuityofdippingplaneisnotclear under the Tyrrhenian side Or the interface continuesbutseismicpropertieschangetogiveaweakerpulse SYNTHETICS DATA
Modeling: Synthetics Observed • 3ModelsegmentstorepresentBB’ profile: • TyrrhenianModel: Moho at 25 km depthfor • 120 km • -OverlappingModel: Tyrrhenian Moho, • anisotropiclayer and • Adriaticdipping Moho for 70km • -AdriaticModel: dipping Moho for 50 km
Discussion • Tyrrhenian & Adriaticcrustshavedifferentthicknesses, but no confirmationofcentralthickening at Apenninescrest • A south-dippingsubcrustalanisotropiclayerappearstoliebeneath under the NorthernApenninesorogen, butwithlimitedextentalong strike • anisotropictexturealignswith interface plunge • No evidenceforsemi-rigidmantle body at base ofApenninesorogen POSSIBLE INTERPRETATIONS: • Adriaticlowercrustsubductingwithlithosphere? • Subducted lower crust coming back to shallower depthsasfor UHP rocks (Beaumontet al. 2001) • Suctionofsubcrustal material fromTyrrhenian toward Adria asApennines Slabretreats
Test Analysis for a single station:Cutigliano (CUTR) verifies the direction-dependent subcrustal interface Anisotropy needed = N10ºE CUTR Synthetics CUTR Observed