Download
1 / 23
230 likes | 388 Views
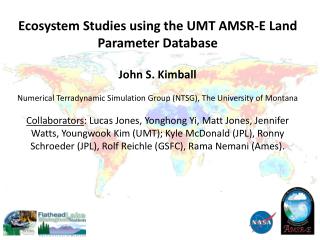
Land Surface Modeling Studies in Support of AQUA AMSR-E Validation PI: Eric F. Wood, Princeton University. Princeton University. Project Goal:

E N D
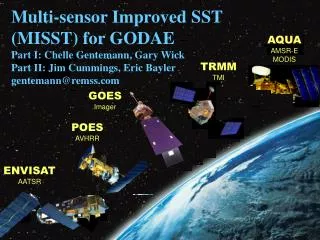
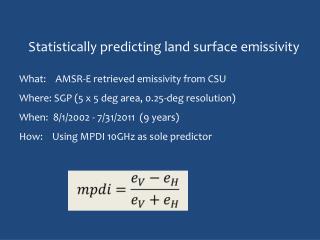
Land Surface Modeling Studies in Support of AQUA AMSR-E Validation PI: Eric F. Wood, Princeton University PrincetonUniversity • Project Goal: • To provide modeling support to the AMSR-E validation activities through a combination of soil moistures retrievals (using the Princeton (PU) Land Surface Microwave Emission Model (LSMEM) and process-based hydrological modeling. • Recent Activities: • Validation using SMEX02/03, NAME, and OK-mesonet data • Comparisons between AMSR-E and TMI over OK region • Today Focus • Intercomparison of two AMSR-E soil moisture retrievals algorithms and their validation.
PrincetonUniversity Basis of the validation research • Soil moisture retrievals used the Princeton (PU) Land Surface Microwave Emission Model (LSMEM) and 10.7 GHz brightness temperatures from the TRMM Microwave Imager (TMI) and AMSR-E. LSMEM is based on Tb(H) and Ts, plus ancillary land surface data (soil, vegetation, etc.) • Retrieval comparisons were with a JPL-version of the AMSR-E retrieval algorithm for TMI and the NASA/AMSR-E 10.7 GHz retrievals; these use a polarization ratio approach and empirical parameters. • Comparisons were also made to SMEX field data, 5-cm soil moisture from 30 Oklahoma mesonet data sites, and to 10-cm soil moisture from a land surface model.
PrincetonUniversity SMEX02: PU/AMSR-E X-Band Soil Moisture Comparison with the ARS SCAN Soil Moisture Monitoring Site
Date Samples Soil Moisture PU/ Avg Std dev AMSR* 6-25 272 12.8 2.6 9.5 6-26 273 12.1 2.8 6-27 273 11.3 2.3 7.0 7-1 103 9.5 1.6 8.5 7-5 271 14.8 2.4 7-6 273 14.4 2.2 14.0 7-7 273 18.4 2.7 28.5 7-8 273 16.6 2.3 17.0 7-9 273 15.3 2.4 17.0 7-11 260 26.4 1.8 26.5 7-12 273 25.2 2.1 PrincetonUniversity SMEX02: PU/AMSR-E 10.7 GHz Soil Moisture Comparison with the Theta Probe Field Data *AMSR-E values indicate the resampled pixel that encompasses the Walnut Creek catchment ~65% of the pixel
(Theta Probe data) PrincetonUniversity SMEX02: PU/AMSR-E X-Band Soil Moisture Comparison with the Field Theta Probe Measurements (Notice how PU/AMSR-E has more realistic variability after rain events)
Dynamic range +/- 20% PrincetonUniversity Rainfall and Retrieved PU/AMSR soil moisture patterns June 26 June 27 - 25 July 5 July 6 – 4 July 19 July 20 – 18
PU/ AMSR PrincetonUniversity NASA/ AMSR NASA/AMSR-E has significantly reduced dynamic range when compared to PU/AMSR-E. Because of scale effects IT IS IMPOSSIBLE TO RESOLVE (VALIDATE) WHICH IS CORRECT. Therefore we must consider statistical consistency between satellite and in-situ observations.
Looking at soil moisture differences between pre- and post-rain days PrincetonUniversity Rainfall (mm) PU/AMSR-E differences % soil moisture NASA/AMSR-E differences – reduced range
PrincetonUniversity AMSR-E Near Surface Soil Moisture AMSR-E retrieved soil moisture represents surface wetness (~0.5cm) and tends to have much lower mean soil moisture but good dynamic range.
PrincetonUniversity Soil Moisture – Rainfall Comparison Precipitation Aug 29/31: Soil moisture …strong influence on soil storage in both the VIC and AMSR responses. Delayed response evident in VIC estimates. 10-cm LSM PU/AMSR
PrincetonUniversity Algorithm Validation/Comparisons over the SGP Used 6 years of TMI 10.7 GHz data (1998-2003) and 2 years of AMSR-E data (2003-2004). With TMI, used JPL/TMI algorithm from Eni Njoku. With AMSR-E, used retrieved soil moisture from the NASA DAAC.
PrincetonUniversity PU/AMSR-E 10.7 GHz Soil Moisture Comparisons with PU/TMI-based Soil Moisture AMSR-E retrieved soil moisture July 23, 2002 TMI retrieved soil moisture July 23, 2002 AMSR-E retrieved soil moisture July 25, 2002 TMI retrieved soil moisture July 25, 2002
TMI soil moisture (%) PrincetonUniversity AMSR-E soil moisture (%) AMSR-E, TMI OK-Mesonet VIC/LSM PU/AMSR-E X-Band Soil Moisture Comparisons with PU/TMI X-Band Soil Moisture Lesson: Retrievals consistent across sensors, but different from in-situ
PrincetonUniversity PrincetonUniversity 30-site OK-mesonet soil moisture 30-site OK-mesonet soil moisture Soil moisture using NASA/JPL algorithm Soil moisture using PU LSMEM algorithm Retrieved soil moisture averaged over 30 Oklahoma mesonet sites
AMSR-E 2am TMI PrincetonUniversity Soil moisture from JPL algorithm Soil moisture from NASA DAAC Soil moisture using PU LSMEM algorithm Soil moisture using PU LSMEM algorithm Algorithm comparison for retrieved soil moisture averaged over 30 Oklahoma mesonet sites
Model vs PU/TMI Model vs OK-mesonet PrincetonUniversity Model vs JPL/TMI Comparisons between LSM and retrieved soil moistures
PrincetonUniversity Statistical consistency between LSM and retrieved soil moistures
PrincetonUniversity Soil moisture retrieved using PU /LSMEM Soil moisture from NASA DAAC AMSR-E results from PU/LSMEM (left) and NASA/DAAC (right)for 2004 AMSR-E am overpasses over the 30 OK-mesonet sites, compared to the 30 mesonet sites
PrincetonUniversity Soil moisture from NASA DAAC Soil moisture retrieved PU/ LSMEM AMSR-E results from PU/LSMEM (left) and NASA/DAAC (right)for 2004 am overpasses over the 30 OK-mesonet sitescompared with the same sites from VIC 2am LSM output. Parabolic trend line has been fitted to both; Note that rainfall has been filtered out of the LSMEM result but not the NASA/DAAC
PrincetonUniversity Implications for retrieval error estimates and use in assimilation • The reality that retrieved soil moistures have different mean values and dynamic ranges implies that new, innovative statistical approaches are needed for validation: “statistical consistency” – this is currently being developed at Princeton. • The lack of a dynamic range in the NASA/JPL DAAC algorithms is problematic, but the two products are well correlated. • Sensitivity analysis for the algorithms are underway. For the PU LSMEM, errors in Ts appear to result in high frequency noise in SM during dry periods. • For individual (validation) points, the errors between satellite retrievals (at 25-40 km scales) can be very large.
PrincetonUniversity Sensitivity of retrieved soil moisture using the PU LSMEM uncertainty in Ts (RMS error 3K) for four OK-mesonet sites (i.e. soil, vegetation, roughness characteristics from the sites) Retrieved soil moisture ‘Observed’ 10.7 GHz brightness temperatures: Tb(V)—red; Tb(H)—black (results from 100 Monte Carlo simulations)
PrincetonUniversity Comparisons between observed and simulated Tb, over 23 OK-mesonet sites, for 363 TMI orbits from 2003
PrincetonUniversity Comparisons between observed and simulated Tb, averaged over 23 OK-mesonet sites, for 363 TMI orbits from 2003