Land-Surface Modeling Performance At NCEP
360 likes | 550 Views
Land-Surface Modeling Performance At NCEP. Ken Mitchell. NCEP Environmental Modeling Center. WRF Land Working Group Workshop: 18 June 03. NCEP : Where America's Climate and Weather Services Begin. GAPP. GCIP. NCEP/EMC. NWS/OHD. NOAA/NESDIS. Dan Tarpley. John Schaake. Ken Mitchell

Land-Surface Modeling Performance At NCEP
E N D
Presentation Transcript
Land-Surface Modeling Performance At NCEP Ken Mitchell NCEP Environmental Modeling Center WRF Land Working Group Workshop: 18 June 03 NCEP: Where America's Climate and Weather Services Begin
GAPP GCIP NCEP/EMC NWS/OHD NOAA/NESDIS Dan Tarpley John Schaake Ken Mitchell Michael Ek Dag Lohmann Victor Koren Bruce Ramsay Andy Bailey Qingyun Duan AFWA George Gayno NCAR Jerry Wegiel Fei Chen Jimy Dudhia Univ. Maryland NASA/GSFC COLA Hugo Berbery Princeton Univ. Rachel Pinker Paul Houser Brian Cosgrove Mike Fennessey Paul Dirmeyer Eric Wood Justin Sheffield Univ. Washington Univ. Oklahoma Rutgers Univ. NOAA/ARL Dennis Lettenmaier Laura Bowling Ken Crawford Jeff Basara Alan Robock Lifeng Luo Atmospheric Research NCEP/CPC Tilden Meyers Jon Pliem Univ. Arizona Alan Betts Soroosh Sorooshian James Shuttleworth Luis Bastidas Wayne Higgins Huug Van den Dool Collaborators
Papers recently submitted to GCIP Special Issue of JGR(Show vugraphs and pass out CDs) • Papers on Coupled Eta/Noah and EDAS • Ek et al. • Berbery et al. • Papers on Uncoupled NLDAS • NLDAS: N. American Land Data Assimilation System • Mitchell et al. overview paper • 9 companion papers by NLDAS collaborators
Systems Using the Noah Land Model OPERATIONAL SYSTEMS • Eta/EDAS: NCEP Eta Model and Eta Data Assimilation System • GFS/GDAS: NCEP Global Forecast System (older version of Noah) • AGRMET: Air Force Agricultural Meteorological Model (USDA) DEMONSTRATION TESTBED SYSTEMS • Eta-RCM: Eta Regional Climate Model, 2-4 month seasonal fore • Eta R/R: Eta-based Regional Reanalysis (underway, 1979-2003) • GFS: NCEP Global Model (most current Noah version) • NLDAS Realtime: N. American Land Data Assimilation System • NLDAS Retrospective: 50-year by CPC (for drought monitoring) • GLDAS: NASA/NCEP Global Land Data Assimilation System • MM5/Noah: at NCAR • WRF/Noah: at NCAR and NCEP • ARPS/Noah: at Center for Analysis & Prediction of Storms (CAPS)
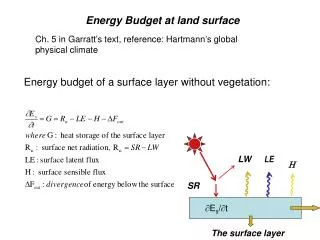
Improving the NCEP MesoscaleEta Model via Land-Surface Initiatives • Eta improvement goals - 2 meter air temperature and humidity - 10 meter wind vector - PBL T and Td profiles - convective stability indices - integrated moisture flux convergence - precipitation and cloud cover
Interannual variability of North American Monsoon - interior Southwest moist dry 30 33 C 29 C 32 32 23 24 24 16 16 16 00 00 12 12 24 24 36 36 48 48 00 12 24 36 48 July 2001 July 1999 July 2000 semi-dry Semi-dry soil in Eta Moist soil in Eta Dry soil in Eta 32 C obs obs Eta Eta Eta forecast hour
ETA MODEL LAND-SURFACE MODELING MILESTONES Since 1996, a series of GCIP/GAPP-sponsored land-surface model related advances have been made to the NCEP mesoscale Eta model and its Eta-based 4-D data assimilation system (EDAS). 31 Jan 1996 multi-layer soil/vegetation/snow model introduced initial soil moisture/temperature from GDAS 18 Feb 1997 new vegetation greenness database from NESDIS refined adjustment of initial GDAS soil moisture refined evaporation over snow and bare soil 09 Feb 1998 increase from 2 to 4 soil layers (10, 30, 60, 100 cm layers) 03 Jun 1998 full self-cycling of EDAS/Eta soil moisture and temperature new NESDIS daily 23-km snow cover and sea ice 15 Mar 1999 "NOAH" name designated for Eta land-surface model 01 Apr 1999 GOES vs Eta skin temperature verification 24 Mar 2000 Eta near-surface regional Forecast Verification System 15 Mar 2001 retrospective NOAH LSM Eta/EDAS testing initiated 24 Apr 2001 realtime NOAH LSM Eta/EDAS testing initiated 02 July 2001 pre-implementation NOAH LSM testing in parallel Eta/EDAS 24 July 2001 frozen soil physics, patchy snowcover (OHD, V. Koren) 12 Feb 2002 improved sub-surface heat flux with snowpack
ETA/NOAH LAND-SURFACE MODEL UPGRADES: 24 Jul 01 • - assimilation of hourly precipitation • -- hourly 4-km radar/gage analysis (Stage V) • cold season processes(Koren et al 1999) -- patchy snow cover -- frozen soil (new state variable) -- snow density (new state variable) • - bare soil evaporation refinements • -- parameterize upper sfc crust cap on evap • - soil heat flux -- new soil thermal conductivity • (Peters-Lidard et al 1998) -- under snowpack (Lunardini, 1981) -- vegetation reduction of thermal cond. (Peters-Lidard et al 1997) • - surface characterization-- maximum snow albedo database • (Robinson & Kukla 1985) -- dynamic thermal roughness length • refinements • - vegetation • -- deeper rooting depth in forests • -- canopy resistance refinements NOAH LSM tested in various land-model intercomparison projects, e.g., GSWP, PILPS 2a, 2c, 2d, 2e, Rhone, and (near-future) DMIP.
July 2001 NOAH LSM improvements in coupled Eta model Successfully Targeted Impacts: 1 - Cold season processes (snow melt, frozen soil) *** reduce near-surface cool bias over snow cover 2 - Early spring wet soils (soil heat flux, bare soil evaporation) *** reduce near-surface moist bias 3 - Summer over non-sparse green vegetation *** reduce near-surface warm bias
REDUCING SURFACE MOIST-COOL BIAS OVER WET-BARE GROUND 12Z, 27 APR 2001, 60-hr model run OLD 2-meter T=> Td=> NEW 2-meter T=> Td=> Champaign, Illinois 36-hr Old model formulation - cool, moist bias in 2-m T, Td New model formulation – reduced cool, moist bias Physics change: new soil thermal conductivity, nonlinear vs linear dependence of direct evap on top layer soil moisture
REDUCING SURFACE MOIST-COOL BIAS OVER WET-BARE GROUND 00Z lowest boundary-layer level (~ 100-150 m) dew point temperature 48-km parallel new formulation (NOAH LSM) 00Z lowest boundary-layer level (~ 100-150 m) dew point temperature 48-km parallel old formulation
00 12 24 36 48 REDUCING NEAR-SURFACE MOIST-COOL BIAS OVER WET-BARE GROUND IN SPRING 84 old NOAH LSM USA northern mid-west new NOAH LSM 75 2-m relative humidity (%) 66 57 obs Eta forecast hour Improved 2-m RH in 48-hour diurnal forecast cycle during Apr-May
North America snowcover 01 Feb 2001 02 Feb 2001 03 Feb 2001 04 Feb 2001 05 Feb 2001 06 Feb 2001 Shallow/retreating snow cover in USA northern plain states
REDUCING SURFACE COOL BIAS OVER MELTING SNOW FEB 2001 ETA MODEL RETROSPECTIVE RUNS snow melt North Platt, Neb. North Platt, Neb. =0 C >0 C skin temp obs>0 C 2-m air temp 0 C 0 C obs,model>0 C model0 C 18Z 18Z 2-m air temp, new formulation 2-m air temp, current formulation warm advection/melting snowpack case: 00Z 02 FEB 2001, 60-hr model run old model formulation (upper left) => bulk of incoming energy melts/sublimates snow => skin temp held at freezing => 2-m air temp held near freezing new model formulation(upper right) => patchy snow cover for snow depth less than threshold depth (veg-type dependent) => reduces surface albedo => more available energy at sfc => skin temp can exceed 0 C => 2-m air temp rises further above freezing.
REDUCING SURFACE COOL BIAS OVER MELTING SNOW 02 FEB 2001 warm advection/melting snowpack case 18Z 2-m air temp, old formulation 18Z 2-m air temp, new formulation The new formulation has less cold bias in 2-m air temp than old operational formulation over this region of shallow melting snowpack. (obs=plotted numbers, model=color-shaded contouring; North Platt, Neb. circled)
Mean diurnal cycle of 2-m air temperature of observations and Eta model 48-hr forecast from 12Z, averaged over 30-day WINTER period of 01 Feb – 01 Mar 2001 at all surface stations over East U.S. Station OBS: solidOPS Eta/NOAH: short dashTEST Eta/NOAH: long dash) +5 Temperature (C) -3 0 48 Forecast Hour
Reducing Summer warm bias over non-sparse green vegetation 00Z, 30 AUG 2000, 60-hr Eta model run Champaign, Illinois OLD 2-meter T=> Td=> NEW 2-meter T=> Td=> Solid Line: surface station observation Dashed Line: coupled Eta / NOAH model forecast Physics change: ground heat flux under vegetation, canopy resistance parameters
Mean diurnal cycle of 2-m air temperature of observations and Eta model 48-hr forecast from 12Z, averaged over 30-day SUMMER period of 12 Aug –12 Sep 2000 at all surface stations over East U.S. Station OBS: solidOPS Eta/NOAH: short dashTEST Eta/NOAH: long dash) 27 Temperature (C) 17 0 48 Forecast Hour
JULY 2-m Air Temperature: EAST (Monthly mean diurnal cycle over 48-h fcst: Obs solid, model dashed)
JULY 2-m Relative Humidity (percent): EAST (Monthly mean diurnal cycle over 48-h fcst: Obs solid, model dashed)
N-LDAS Design(The Uncoupled Approach) • 1. Force models with 4DDA surface meteorology (Eta/EDAS), except use actual observed precipitation (gage-only daily precip analysis disaggregated to hourly by radar product) and hourly downward solar insolation (derived from GOES satellites). • 2. Use 4 different land surface models: • NOAH (NOAA/NWS/NCEP) • MOSAIC (NASA/GSFC) • VIC (Princeton U./ U. Washington) • Sacramento (NOAA/OHD) • 3. Evaluate results with all available observations, including soil moisture, soil temperature, surface fluxes, satellite skin temperature, snow cover and runoff.
LDAS Run Modes:1) Realtime, 2) Retrospective • REALTIME: 15 Apr 1999 to 15 Dec 2001 • -- NCEP realtime forcing • RETROSPECTIVE: 01 Oct 1996 to 30 Sep 99 • -- Mandated largely by spin-up issues • -- NASA-assembled retrospective forcing • --- Higgins NCEP/CPC reprocessed precipitation forcing: • ---- more gages obs, more QC • --- Pinker U.Md reprocessed solar insolation forcing • ---- better cloud screening, more QC • Rutgers University compared the soil moisture, soil temperature, surface flux results from the retrospective LDAS runs to observations over Oklahoma/Kansas for last retro year.
LDAS Model Mean Annual Evaporation (mm) over Oct 97 – Sep 99
NLDAS Simulated River System Upstream area [log10(km^2)] Travel time to outlet [days] River flow direction mask Large River basins
Mean annual modeled normalized model runoff bias: Oct 97-Sep 99
* * * *
Fig. 16 From Robock et al.
April 1999 July 1999 Fig. 22 SGP ARM/CART Monthly Mean Diurnal Cycle of Surface Energy Fluxes
April 1999 July 1999 Fig. 24 Monthly Mean Diurnal Cycle of Surface Skin Temperature