Download
1 / 81
810 likes | 830 Views
Join the mathematicians in testing theories of gravity in different planets using Desmos technology. Discover and explore the universe!

E N D
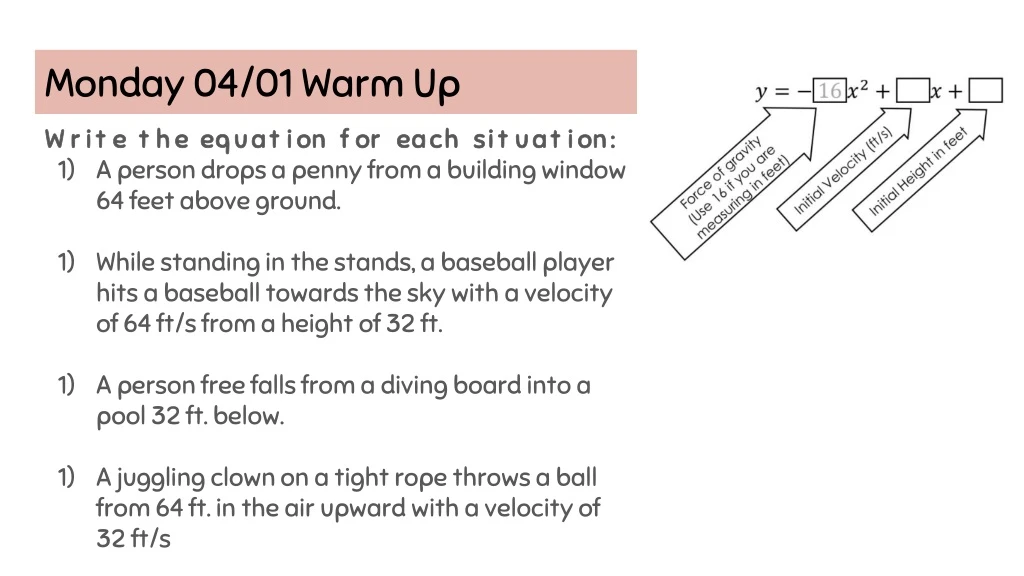
Monday 04/01 Warm Up Write the equation for each situation: • A person drops a penny from a building window 64 feet above ground. • While standing in the stands, a baseball player hits a baseball towards the sky with a velocity of 64 ft/s from a height of 32 ft. • A person free falls from a diving board into a pool 32 ft. below. • A juggling clown on a tight rope throws a ball from 64 ft. in the air upward with a velocity of 32 ft/s
Gravity in the Galaxy Planet Earth is home to very curious humans who want to expand their knowledge of space and other planets. Scientists are prepared to run tests on different planets, but want to mathematically test their theories first. You are the mathematicians that are going to explore the universe!
Gravity in the Galaxy You are going to work with a partner to help the scientist! Luckily we also have the technology to discover and explore our universe! You can use Desmos to discover what you need to know about each planet. This will also help ----------->
Tuesday 04/02 Warm Up Finish Gravity in the Galaxy
Example 99, 92, 92, 100, 90, 92, 91, 93, 93, 35 Mean: Median: Mode: Range: Outlier: Skew: No Outlier: Mean: Median: Mode: Range:
Example 60, 65, 70, 77, 74, 73, 68, 72, 95 Mean: Median: Mode: Range: Outlier: Skew: No Outlier: Mean: Median: Mode: Range:
Your Turn! 50, 51, 48, 42, 12, 44, 45 Mean: Median: Mode: Range: Outlier: skew: 56, 45, 45, 60, 62, 48, 50, 52 Mean: Median: Mode: Range: Outlier: Skew:
Your Turn! 99, 99, 99, 98, 97, 95, 97, 98 Mean: Median: Mode: Range: Outlier: skew: 8, 2, 5, 4, 7, 3, 6, 22 Mean: Median: Mode: Range: Outlier: Skew:
Wednesday 04/03 Warm Up Math 1 Unit 2 Test Scores Mean: Median: Mode: Range: Outlier: Skew:
Skittle Scavenger Hunt Round 1: Take data of YOUR skittles (15 minutes) Round 2: Take data of your PARTNERS data (15 minutes) Round 3: Take you and your partner’s data and combine the data with another partner group Round 4: Combine your group of 4 with another group of 4
Word Problems Susie’s test grade in Math are 92, 88, 64, 94, 80 and 95. What is her test average? The scores below represent Johnny’s test scores in Math. What effect does including the outlier have on his average? 81, 97, 100, 89, 33, 88, 79, 91, 90, 83, 87, 82, 80, 93, 92 85.5 The outlier (33) pulls his average down 3.7 points 84.3 With the outlier 88 without the outlier
Finding the missing data Mara knew she had an 88 average in her biology class, but she lost one of her papers. The three papers she could find had scores of 98, 84, and 90. What was the score on her fourth paper? 80
Thursday 04/04 Warm Up • Susie’s test grade in Math are 92, 88, 64, 94, 80 and 95. What is her test average? • The scores below represent Johnny’s test scores in Science. What effect does including the outlier have on his average? 81, 97, 100, 89, 33, 88, 79, 91, 90, 83, 87, 82, 80, 93, 92 • Mara knew she had an 88 average in her biology class, but she lost one of her papers. The three papers she could find had scores of 98, 84, and 90. What was the score on her fourth paper?
Summarize It: Calvin plays outside MORE in the summer than in the winter. Most winter weeks were less than 5 hours, but most summer weeks were more than 12 hours! Find the Outliers, the Median, Quartiles and the Range
Friday 04/05 Warm Up Find the minimum, lower quartile, median, upper quartile, maximum, and range of each set of data. And draw a box and whisker plot from the data values. • 0, 0, 1, 1, 2, 2, 3, 4, 5 • 90, 99, 98, 95, 97, 90, 95, 97, 98, 89
Summarize It: Calvin plays outside MORE in the summer than in the winter. Most winter weeks were less than 5 hours, but most summer weeks were more than 12 hours! Find the Outliers, the Median, Quartiles and the Range
Examples of Box and Whisker • Draw a box and whisker plot for the following set of data: 29, 34, 35, 36, 28, 32, 31, 24, 24, 27, 34 • Draw a box and whisker plot for the following set of data: 16, 14, 13, 13, 18, 12, 11, 12, 12, 15
Put your phones in the back Get a calculator and Begin to start your quiz
Monday 04/08 Warm Up • Create a box and whisker plot with the following set of data: 1, 2, 5, 6, 9, 12, 7, 10 • Find the mean, median, and range of the following set of data: 7, 6, 2, 7, 8, 3, 12, 9, 7, 4, 6, 7, 11
Tuesday 04/09 Warm Up Calculate the standard deviation for the data set: 60, 62, 63, 65, 68, 60, 70, 78, 65, 60
You Try! Find the mean, population and sample standard deviation by using your calculator • 6, 22, 4, 15, 14, 8, 8 • 10, 15, 12, 20, 25, 22, 29
Hair Measuring Activity • Record the classes hair length on the board in a table, similar to the one we used yesterday. So the variable of interest, x, is hair length. • What is the average hair length in the class, based on this vary “unrandom” sample? • Finish filling out the table using the steps we learned yesterday to find the variance and standard deviation.
Hair Measuring Activity • What conclusion(s) can you arrive at if the standard deviation for the hair length of an entire class is zero? • Consider the groups in the room and identify the group with the smallest standard deviation and the largest deviation.
Hair Measuring Activity • A new girl was added to the class and her hair length was equal to the average hair length for the class. What impact will this addition have to the standard deviation for the class? To the mean? • If everyone cut an inch off of their hair what would happen to the standard deviation and the mean? • If everyone ate a ton of bananas and their hair length doubled, what would happen to the standard deviation and mean?
Wednesday 04/10 Warm Up • After you graduate high school, you want to move to a state that has consistently warm weather. Which state would you choose to move to? Florida: 77, 88, 65, 90, 67 California: 73, 75, 69, 80, 81 • Based on the information listed below, which student had more inconsistent grades on their report card? Alison: 88, 90, 87, 91 Doug: 90, 94, 83, 80
Example Use the data in the table below to create a scatter plot, and then determine the relationship between the two variables by looking at the graph. • There is a positive, linear relationship between a person’s height and their weight • As a person’s height increases so does their weight
Thursday 04/11 Warm Up A history teacher asked her students how many hours of sleep they had the night before a test. The data below shows the number of hours the student slept and their score on the exam. Plot the data on a scatter plot. Tell me the correlation and explain.
Linear Exponential Quadratic Positive Negative No
There is a positive linear correlation between the radius and the circumference of a circle • As the radius increases so does the circumference • There is no correlation between the money spent in advertising and the sale of the coffee shop
Life Size Scatter Plot! • What is the x-variables and what is the y-variables? • What question is someone trying to answer with the data? • What type of correlation is there in the data? • What conclusion can you draw from the data?
Friday 04/12 Warm Up • Draw a box and whisker plot for the data set: 12, 14, 14, 12, 16, 13, 11, 14, 18 • Draw a box and whisker plot for the data set: 32, 34, 36, 37, 36, 37, 38, 37, 38
Tuesday 04/23 Warm Up Welcome Back!! Determine the relationship between the age and the playing hours in a week. Determine the relationship between the values of X and Y.
Effective Flash Cards • Make your own flash cards 5. Break complex concepts into multiple questions 2. Mix Pictures and Words 6. Say your answers out loud when studying 3. Use mnemonic devices to create mental connections 7. Study your flash cards in both directions 4. Write only one question per card 8. Don’t treat flash cards like a silver bullet


