Download
1 / 28
280 likes | 427 Views
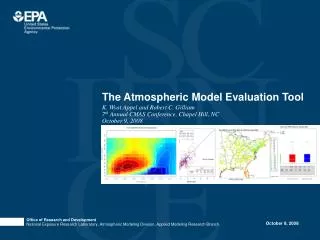
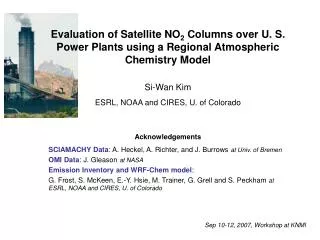
Evaluation of Satellite NO 2 Columns over U. S. Power Plants using a Regional Atmospheric Chemistry Model. Si-Wan Kim ESRL, NOAA and CIRES, U. of Colorado. Acknowledgements SCIAMACHY Data : A. Heckel, A. Richter, and J. Burrows at Univ. of Bremen OMI Data : J. Gleason at NASA

E N D
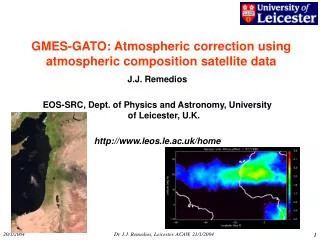
Evaluation of Satellite NO2 Columns over U. S. Power Plants using a Regional Atmospheric Chemistry Model Si-Wan Kim ESRL, NOAA and CIRES, U. of Colorado Acknowledgements SCIAMACHY Data: A. Heckel, A. Richter, and J. Burrows at Univ. of Bremen OMI Data: J. Gleason at NASA Emission Inventory and WRF-Chem model: G. Frost, S. McKeen, E.-Y. Hsie, M. Trainer, G. Grell and S. Peckham at ESRL, NOAA and CIRES, U. of Colorado Sep 10-12, 2007, Workshop at KNMI
Outline • Background • 2. WRF-Chem model • 3. Satellite instruments and retrievals • 4. NO2 columns over power plants • 5. Conclusions • 6. Future Plans
Uncertainties in NOx emission inventory (“bottom-up emission”) Evaluation of estimated NOx emissions with satellite observed NO2 columns NOx emissions NO2 columns (Martin et al., 2003, Beirle et al., 2003, Richter et al., 2005, van der A, 2006, Kim et al., 2006… ) For power plants, known NOx emissions (CEMS) --> Accurate model NO2 columns --> Evaluation of satellite NO2 observations 1. Background
Background Why Western U.S. ? Western US Eastern US
Background Observation of NO2 Columns by Satellites SCIAMACHY OMI
Background Identification of Sources (Power Plants) Colstrip North Valmy Dave Johnston/ Laramie River Intermountain Jim Bridger/ Naughton Hunter / Huntington Reid Gardener Craig/Hayden Bonanza Mohave Four Corners/ San Juan Navajo Cholla/Coronado/ Springerville
Background Identification of Sources (Power Plants) Colstrip North Valmy Dave Johnston/ Laramie River Intermountain Jim Bridger/ Naughton Hunter / Huntington Reid Gardener Craig/Hayden Bonanza Mohave Four Corners/ San Juan Navajo Cholla/Coronado/ Springerville
Weather Research and Forecasting – Chemistry model (www.wrf-model.org/WG11) Simulate chemistry and aerosol online within WRF model Option to simulate coupling among chemistry, aerosol, radiation and clouds. • Various chemical mechanisms (kpp available) and aerosol modules Various physical packages: PBL, Microphysics, Radiation and Convective parameterizations 2. WRF-Chem Model
WRF-Chem Model Setup • Period: 2005 Summer • Initial & Boundary Condition: NCEP GFS & • Idealized chemical soundings • Emissions : NEI99 updated following CEMS 2005 • PBL: YSU Microphysics: WSM5 Radiation: Dudhia shortwave Cumulus parameterization: Grell & Devenyi Land-Surface: Noah Chemical mechanisms: RADM2, RACM, RACM-ESRL Aerosol: MADE-SORGAM Advection scheme: Original & Positive Definite
WRF-Chem Model Difference due to Chemical Mechanism
WRF-Chem Model Difference due to Advection Scheme Four Corners & San Juan Power Plants
• SCIAMACHY (ENVISAT) Period: March 2002 ~ Resolution: 60 x 30 km2 Global coverage at the equator: 6 days (due to alternate limb nadir viewing Time: 10:30 LT • OMI (EOS-Aura) Period: November 2004 ~ Nadir View Resolution: 13 x 24 km2 (nominal), 13 x 8 km2 (zoom-in) Global coverage: 1 day Time: 1:30 LT • Sampling Clear Sky (Pixels with Cloud fraction < 0.15) For OMI, 10 < swath mode number < 50 are used. 3. Satellite instruments
Satellites Subtraction of stratospheric NO2 Vertical sensitivity (AMF, Air Mass Factor) A priori NO2 profile Aerosols Terrain Height Albedo (Reflectivity) Retrieval Issues: Tropospheric NO2 columns
Satellites • A priori NO2 profile Retrieval Issues (prof1) SCIAMACHY MOZART NO2 profile SCIAMACHY WRF-Chem NO2 profile
Satellites • A priori NO2 profile Retrieval Issues (prof2) AMF-WRFprof AMF-MOZprof
Satellites • Aerosols Retrieval Issues (aero1)
Satellites • Aerosols Retrieval Issues (aero2) AMF-NoAerosol AMF-EdgarAerosol
Satellites Retrieval Issues (terrain)
* Summer of 2005 SCIA OMI Jim Bridger/ Naughton 4. NO2 columns over power plants Intermountain Four Corners/ San Juan Navajo Mohave WRF WRF
Power plant emissions * 14 day running mean Four Corners (SCIAMACHY) Model chemistry ~7% Model advection ~8% Satellite a priori profile ~6% Satellite aerosol ~3%
Power plant emissions Four Corners (OMI) Model Chemistry ~2% Model Advection ~11%
Power plant emissions Jim Bridger & Naughton
Power plant emissions Intermountain
Power plant emissions Mohave
Power plant emissions Navajo
Summary: Power Plants • SCIA1: MOZART NO2 profile / SCIA2: WRF-Chem NO2 profile • Model is overestimated to SCIA and is underestimated to OMI. However, both satellites show good agreement with model for Four Corners/San Juan power plants. In general, smaller boxes show higher biases for SCIA
5. Conclusions * Satellite NO2 columns agree well with model NO2 columns over the regions where total NOx emission is dominated by power plants. For small size power plants, however, SCIAMACHY data are higher than the model results, while OMI and the model agree reasonably well, implying that the data frequency and resolution of SCIAMACHY limit the detection of these confined power plants. * Applying positive advection scheme for RACM-ESRL (not done yet) may reduce discrepancy between SCIAMACHY and the model and increase discrepancy between OMI and the model. * Inclusion of hourly and daily varying power plant emissions may reduce the discrepancy between model and satellites. * The analysis can be extended to urban and highway emissions, which was known to be much more uncertain than those from power plants.
* Include daily variation of emissions from Four Corners and San Juan Power Plants: reductions in weekends and holidays by 25% 6. Future Plans