Download
1 / 42
420 likes | 546 Views
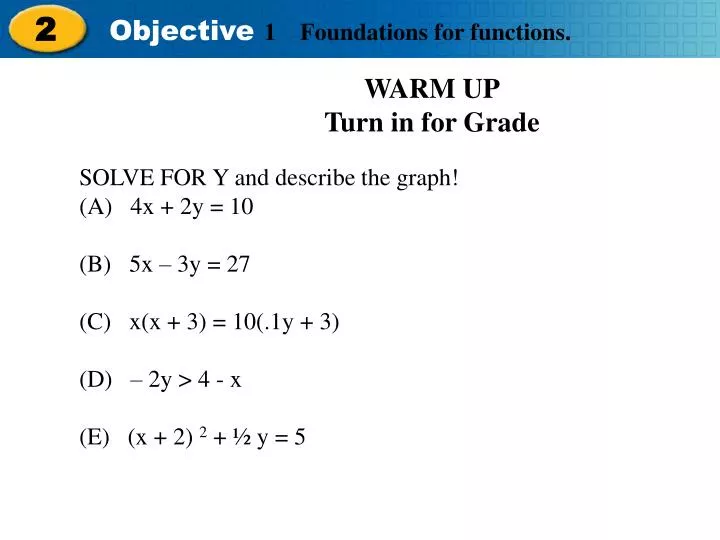
WARM UP Turn in for Grade SOLVE FOR Y and describe the graph! (A) 4x + 2y = 10 (B) 5x – 3y = 27 (C) x(x + 3) = 10(.1y + 3) (D) – 2y > 4 - x (E) (x + 2) 2 + ½ y = 5. OBJECTIVE:

E N D
WARM UP • Turn in for Grade • SOLVE FOR Y and describe the graph! • (A) 4x + 2y = 10 • (B) 5x – 3y = 27 • (C) x(x + 3) = 10(.1y + 3) • (D) – 2y > 4 - x • (E) (x + 2) 2 + ½ y = 5
OBJECTIVE: • The student understands that a function represents a dependence of one quantity on another and can be described in a variety of ways. • The Student is expected to • (A) Describe independent and dependent quantities in functional • relationships; • (B) Gather and record data - use data sets to determine functional • relationships between quantities; • (C) Describe functional relationships for given problem situations and write • equations or inequalities to answer questions arising from the situations; • (D) Represent relationships among quantities using [concrete] models, tables, graphs, diagrams, verbal descriptions, equations, and inequalities; and • (E) Interpret and make decisions, predictions, and critical judgments from functional relationships.
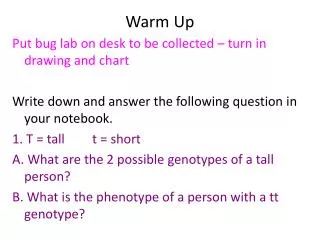
A function is a set of ordered pairs (x, y) in which each x-coordinate is paired with only one y-coordinate. In a list of ordered pairs belonging to a function, no x-coordinate is repeated. The distance you can drive an automobile depends on the number of gallons of gas in the car’s fuel tank. This is a good example of a function. Independent dependent Fuel in Tank Distance (gallons) (miles) 1 20.5 x-coordinate y-coordinate 2 41.0 3 61.5 4 82.0 5 102.5 6 123.0 For a given number of gallons of fuel, there is exactly one distance listed. Independent dependent
There are two ways to test a set of ordered pairs to see whether it is a function. 1. Examine the list of ordered pairs. Is this set of ordered pairs a function? {(–1, 1), (1, 5), (3, 9)} To determine if the pairs represent a function examine the x-coordinates. No Do any numbers repeat? Then the pairs represent a function. Is this set of ordered pairs a function? {(5, –2), (3, 7), (–1, –8), (8, –2)} Yes, because no x value repeats in the ordered pairs.
2. Examine the graph of the function. Use a vertical line to determine whether two points have the same x-coordinate. If two points in the function lie on the same vertical line, then they have the same x-coordinate, and the set of ordered pairs is not a function. Do the ordered pairs graphed below represent a function? This is not a function because of the last 2 points.
Is the graph shown below a function? This is a function because it passes the vertical line test.
In a function, the y-coordinate is described in terms of the x-coordinate. The value of the y-coordinate depends on the value of the x-coordinate. Niyum rents a sailboat by the hour. He pays a $27 fee and $15 for each hour he uses the sailboat. Let c represent the total cost of renting the sailboat for h hours. Write an equation that represents the dependent variable in terms of the independent variable. Which variable is the dependent variable, c or h? c When writing the equation, the dependent variable goes on the left. c = 27 + 15h What makes up the cost of the sailboat rental? $27 and $15 for each hour
When Shannon goes skydiving, she wears a device that measures her altitude in one-second intervals from the time she jumps until she opens her parachute. If she jumps from an altitude of 4000 meters, the equation h =4000 4.9t2 describes h, Shannon’s altitude in meters, in terms of t, the number of seconds until she opens her parachute. Right side Left side h altitude in meters Which is the dependent variable? t time in seconds Which is the independent variable? What are the constants in the problem? 4000 and 4.9 are constants because they do not change in the problem.
Try It For a science experiment Mariana measures the rate at which a liquid cools. She finds that for the first few minutes the liquid cools, its temperature can be given using the equation t = 217 18m, in which m represents the number of minutes the liquid has been cooling and t is its temperature in °C. independent The _________________ quantity is the number of minutes the liquid has been cooling. dependent The _________________ quantity is the temperature of the liquid because the temperature depends on the number of minutes the liquid has been cooling. 217 18 The values _______ and _______ are the constants because they do not change.
Here are three methods you can use to determine whether two different representations of a function are equivalent. Method Action Match a list or table of ordered pairs to a graph. ● Show that each ordered pair listed matches a point on the graph. Match an equation to a graph. ● Determine whether they are both linear or quadratic functions. ● Find points on the graph and show that their coordinates satisfy the equation. ● Find points that satisfy the equation and show that they are on the graph. Match a verbal description to a graph, an equation, or an expression written in function notation. ● Use the verbal description to find ordered pairs belonging to the function and then show that they satisfy the graph, equation, or function rule. ● Find points on the graph or ordered pairs satisfying the equation or rule and show that they satisfy the verbal description.
Any equation in the form y =mx +b is a linear function. Its graph will be a line. x y -3 -3 -2 -1 1 5 2 7 … … y = 2x + 3 Any equation in the form y = ax2 + bx +c is a quadratic function. Its graph will be a parabola. x y -3 0 -1 -4 0 -3 1 0 3 12
Does the ordered pair (2, 20) belong to the function h(x) =x(x + 5) + 6? For the ordered pair (2, 20), x = 2. Determine whether h(x) = 20 when x = 2. Substitution Method h(x) = x(x + 5) + 6 Write the equation Substitute 2 for x in the equation h(2) = 2(2 + 5)+ 6 Follow PEMDAS parentheses first h(2) = 2(7) + 6 Multiplication h(2) = 14 + 6 Addition h(2)= 20 Calculator Method Select y= Enter x(x + 5) + 6 into Y1 Select 2nd Table and find and find x value of 2 Verify y = 20
A variety of methods of representing a function are shown below. Which example represents a function that is different from the others? A. Verbal Description The value of y is 1 more than the square of the value of x. D. Mapping of Selected Values -3 9 0 0 1 1 4 16 x2 (-3)2 + 1 = 10 y = + 1 Notice F B. List of Selected Values {(2, 5), (0, 1), (1, 2), (3, 10), (5, 26), …} Notice B and C values E. Graph C. Table of Selected Values x y 2 5 0 1 -1 2 -4 17 … … F. Equation y =x2 + 1
The table shows the functional relationship between x and y. x y 1 0 2 3 3 8 4 15 1 3 Pattern not linear 1 5 1 Use function notation to write a rule that represents this relationship. Look for a pattern between the ordered pairs of the function. NOTE: If the pattern is linear the slopes will be the same. Use the difference between the numbers to find the slope. Try a quadratic relationship when the pattern is not linear. Notice each y value is 1 less than the square of the x value 12 = 1 22 = 4 32 = 9 42 = 16 y = x2 - 1 Enter the x values into L1 and the y values into L2 Use the Calculator Select STAT, Edit Y = Ax2 + Bx + c A = 1 B = 0 C = -1 Select STAT, Equations, Quadratic Reg
Does the graph below represent the function y = 2x2 + 4? Method 1 Substitute several x values from the graph into the function and Check the y values. Y = 2(1)2 + 4 = 6 (1, 6) The graph does not represent the Function. Method 2 Graph the function with the graphing calculator and compare the graphs.
Does the graph below represent the inequality y≤ ⅔x - 1? b m Remember: ≤ equals a solid line < equals a dashed line Use y = mx + b to check the line. The line is correct. Second Method Graph it! Now check the boundary (shaded area) by picking any point in the region. Try (6, 0) 0 ≤ ⅔(6) - 1 0 ≤ 3 The graph does represent the inequality.
Warm UP What is the Domain and Range of : 1. y - x = 1 2. x2 – y +2 = 0 Write a paragraph to describe Domain and Range?
Distributive Property The Distributive Property is easy to remember, if you recall that "multiplication distributes over addition". Formally, they write this property as "a(b + c) = ab + ac". Associative Property "Associative" comes from "associate" or "group", so the Associative Property is the rule that refers to grouping. For addition, the rule is "a + (b + c) = (a + b) + c”. Commutative Property "Commutative" comes from "commute" or "move around", so the Commutative Property is the one that refers to moving stuff around. For addition, the rule is "a + b = b + a”.
How Can You Draw Conclusions from a Functional Relationship? Use these guidelines when interpreting functional relationships in a real-life problem. ● Understand the problem. ● Identify the quantities involved and any relationships between them. ● Determine what the variables in the problem represent. ● For graphs: Determine what quantity each axis on the graph represents. Look at the scale that is used on each axis. ● For tables: Determine what quantity each column in the table represents. ● Look for trends in the data. Look for maximum and minimum values in graphs. ● Look for any unusual data. For example, does a graph start at a nonzero value? Is one of the problem’s variables negative at any point? ● Match the data to the equations or formulas in the problem.
The graph below shows the temperature in a town over the course of one day During what time period did the temperature increase at the greatest rate? Remember: rate equals slope and the steeper the line the greater it’s slope. Evaluate each segments slope for the greatest increase. During the time from C to D the temperature increased the most.
Sam works at an electronics store. The graph shows the commission he earns on a sale as a function of the cost of the item he sells. What will Sam’s approximate commission be if he sells an item that costs $67.50? Find the cost of the item on the x-axis, draw a vertical line to the graph. The Commission is about $7.00
Question 1 The basketball team is ordering T-shirts to sell for a fund-raiser. The team paid $275 for the shirts and will sell them for $12 each. The relationship between the number of shirts sold and the team’s profit from the sale of the shirts can be represented by the function f(n) = 12n + 275, in which n represents the number of shirts sold. What is the dependent quantity in this functional relationship? A The number of shirts sold B The amount the team paid for the shirts C The team’s profit from the sale of the shirts D The selling price of the shirts
Question 2 Liang has $35 to spend on movie rentals and snacks for the weekend. He spends $12 on popcorn and soda. If the movie store rents DVDs for $4 each, which inequality models n, the number of DVDs Liang is able to rent? A 4n + 12 ≤ 35 B 4n - 12 ≤ 35 C ≤ 12 D 35 - 4n ≤ 12 35 4n
Question 3 Which of the following tables describes a functional relationship between dependent and independent quantities?
Question 4 The total cost of an item at a store is the price of the item plus 6.5% sales tax. If c, the total cost of the item, is a function of x, the price of the item, which function models this situation? A c = x + 6.5 B c = 6.5x C c = 1.065x D c =x + 1.065
Question 5 A lawn and garden store displays the following table to show customers the amount of fertilizer needed for the corresponding lawn size. Which equation best represents the relationship between s, the size of the lawn, and f, the pounds of fertilizer required? s A f = 100s B f = C f = 50s D f = 100 s 50
Question 6 Which table contains points on the graph of the function f(x) = 4 - 2x?
Question 7 Which graph below represents the quadratic function y = 3x2 + 1?
Question 8 Which graph represents the inequality 2x + y ≤ 10?
Question 9 The table below shows independent and dependent values in a functional relationship. Which function best represents this relationship? A f (x) = 2x2 + 5 B f (x) = x2 + 5 C f (x) = 2x + 5 D f (x) = x + 5
Question 10 The graph shows the number of gallons of gas used by Maria’s car as a function of the number of miles driven. About how many gallons of gas will Maria need for a 170-mile trip? A 7 gal B 8.5 gal C 9.5 gal D 11 gal
Question 1 The basketball team is ordering T-shirts to sell for a fund-raiser. The team paid $275 for the shirts and will sell them for $12 each. The relationship between the number of shirts sold and the team’s profit from the sale of the shirts can be represented by the function f(n) = 12n + 275, in which n represents the number of shirts sold. What is the dependent quantity in this functional relationship? A The number of shirts sold B The amount the team paid for the shirts C The team’s profit from the sale of the shirts D The selling price of the shirts
Question 2 Liang has $35 to spend on movie rentals and snacks for the weekend. He spends $12 on popcorn and soda. If the movie store rents DVDs for $4 each, which inequality models n, the number of DVDs Liang is able to rent? A 4n + 12 ≤ 35 B 4n - 12 ≤ 35 C ≤ 12 D 35 - 4n ≤ 12 35 4n
Question 3 Which of the following tables describes a functional relationship between dependent and independent quantities?
Question 4 The total cost of an item at a store is the price of the item plus 6.5% sales tax. If c, the total cost of the item, is a function of x, the price of the item, which function models this situation? A c = x + 6.5 B c = 6.5x C c = 1.065x D c =x + 1.065
Question 5 A lawn and garden store displays the following table to show customers the amount of fertilizer needed for the corresponding lawn size. Which equation best represents the relationship between s, the size of the lawn, and f, the pounds of fertilizer required? s A f = 100s B f = C f = 50s D f = 100 50 s
Question 6 Which table contains points on the graph of the function f(x) = 4 - 2x?
Question 7 Which graph below represents the quadratic function y = 3x2 + 1?
Question 8 Which graph represents the inequality 2x + y ≤ 10?
Question 9 The table below shows independent and dependent values in a functional relationship. Which function best represents this relationship? A f (x) = 2x2 + 5 B f (x) = x2 + 5 C f (x) = 2x + 5 D f (x) = x + 5
Question 10 The graph shows the number of gallons of gas used by Maria’s car as a function of the number of miles driven. About how many gallons of gas will Maria need for a 170-mile trip? A 7 gal B 8.5 gal C 9.5 gal D 11 gal