Download
1 / 1
10 likes | 80 Views
This study utilizes long-term altimeter observations to analyze the impact of South Nova Scotian shelf inflow on Gulf of Maine's seasonal and interannual freshness variability. The research assesses the impact of upstream current anomalies on Gulf of Maine salinity change and explores the role of wind stress in controlling inflow variation. The Gulf of Maine water exchange dynamics, influenced by Scotian Shelf waters and channels, play a crucial role in salinity anomalies and ecosystem effects. The study examines Gulf-wide salinity anomalies caused by Scotian Shelf water inflow and highlights the significance of understanding interannual variability for ecosystem management. The research combines satellite altimeter data, in-situ buoy measurements, and hydrographic data to uncover the freshwater inflow dynamics and their implications on Gulf of Maine salinity. The findings provide robust evidence of the remote freshwater inflow's impact on Gulf of Maine's freshness variability.

E N D
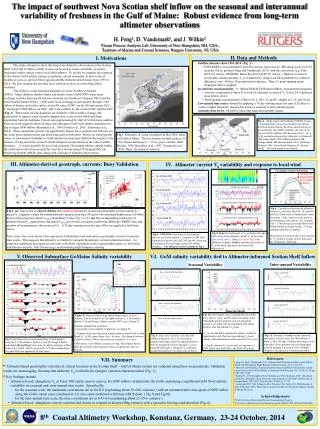
The impact of southwest Nova Scotian shelf inflow on the seasonal and interannual variability of freshness in the Gulf of Maine: Robust evidence from long-term altimeter observationsH. Feng1,D. Vandemark1, and J. Wilkin2 1Ocean Process Analysis Lab ,University of New Hampshire, NH, USA ; 2Institute of Marine and Coastal Sciences, Rutgers University, NJ, USA • I. Motivations II. Data and Methods • Satellite altimeter data 1993-2014 ( Fig. 2 ) • UNH-RADS Coastal Altimeter Data Processing:reprocessed 1-HZ along-track sea level anomaly (SLA) product( Feng and Vandemark, 2011) with the corrections (e.g. Tide: GOT 4.8; Atmos: MOG2dG; Mean Sea Level: DTU10, and etc.). Surface crosstrack geostrophic current anomaly Vg is estimated by along-track SLA gradients by centered difference over ~60 km (10 ground points) distance. Then a 5-point running mean alongtrack filter is applied. • In-situ buoy measurements: (U. Maine/NERACOOS moored Buoy measurement program) • velocity components at Buoy N is used for altimeter crosstrack Vg (Track 24) validation from 2004 to 2014. • Hydrographic measurements at Buoys N, L, M, I, E, and B (depths of 1,20, and 50 m) • Low-passed time series: formed by applying a 70 day running mean low pass (LP) filter to remove higher frequency aliasing but preserve seasonal to inter-annual signals. • Anomaly time series: formed by removing long-term monthly means. This study attempts to show that long-term altimetric observations in the Scotian Shelf (SS)-Gulf of Maine (GoM) system can be used to assess variability of remote freshwater inflow and its control on GoM freshness. To do this we examine the response of the interior GoM salinity change to upstream current anomalies, at time scales of months to years, as derived from regional satellite altimeter observations from 1993 to 2014. We also examine the role that local wind stress plays in controlling inflow variation. The GoM is a semi-enclosed marginal sea in the Northwest Atlantic (NWA). Many offshore shallow banks and shoals restrict GoM-NWA water mass exchange to flows from the SS and two channels, the Northeast Channel (NEC) and the Great South Channel (GSC). GoM water mass exchange occurs mainly through 1) the inflow of fresher and colder surface water SS water (SSW) via the SS and eastern NEC, 2) the deeper NWA inflow via NEC, and 3) the outflow by the western NEC and the GSC (Fig. 1). Water mass mixing dynamics are related to relative inflow change, due particularly to equator-ward coastally trapped flow on the Scotia Shelf and Slope originating from the Labrador Current and supplemented by Gulf of St.Lawrence outflow. Previous work suggests observed large, but infrequent, Gulf-wide salinity anomalies are due to larger SSW inflow (Mountain et al., 1994; Smith et al., 2001; Townsend et al., 2014). These anomalous periods can significantly impact the ecosystem and fisheries via the water mass characteristics and altered buoyant stratification. However, clarifying the source of interannual variability in GoM salinity has been quite difficult due largely to the absence of long-term time seriesof current/transport measurements in the critical inflow locations. It is now possible for us to look at hourly 50-m depth salinity signals within the GoM and its advection around the coast for a decade using US Integrated Ocean Observing System (IOOS) data, along with a decade of altimeter observations. Bay of Fundy I Scotian Shelf E L M B N NEC Georges’ bank GSC Fig .2 . Study region with altimeter TOPEX, Jasons-1/2 ground tracks whose pass numbers are labeled; the black points indicate the observation locations at the shelf edge 100-1000m isobaths), the sites of six buoy (red dots) labeled with their names( N, L, M, I, E, B) and meteorological site (blue dot) at Yarmouth (JB: Jordan Basin; WB: Wilkinson Basin; GB: Georges Bank; BB: Browns Bank: NEC: Northeast Channel; GSC: Great South Channel; SS: Scotian Shelf). The track numbers are labeled Fig 1 Schematic of ocean circulation in the NWA shelf and Gulf of Maine. The key features include surface ( 0- 75m, black) and deeper ( < 75 m, grey) currents (after Brooks, 1985; Beardsley et al., 1997; Townsend et al., 2014). Buoy locations are lettered. Track 100 Track 202 Track 24 Track 65 IV. Altimeter current Vg variability and response to local wind • III. Altimeter-derived geostroph. currents: Buoy Validation Vg response to local wind forcing Alongshore downwelling wind stress direction Vg at Track 100 (a) Vg at Track 24 (b) Vg at Track 202 Fig 6. Correlations between the altimeter-derived Vg at Tracks 100, 024, 202 and 065 and local wind stress in Yarmouth at varied directions. (Tdir: relative to true north in meteorological convention). For example, Tdir = T180 (0) indicates wind blows from North (South) to South( North). A 70 day running mean filter is applied. This sensitivity analysis shows the response of Vg holds at a range of directions near the alongshore (T240 deg.) Fig 3. (a) Time series of Jason1 (black) and Jason2 (red) surface crosstrack geostrophic current (anomaly + mean) Vg (negative values for southwestward ) measured on Pass 24 and in situ measured depth-mean (32-48m) across-track projected current VADCP from Buoy N(See Fig. 1 or 2); (b) The corresponding scatter plot of altimeter-based Vg against buoy-measured VADCP given with correlation coefficient, difference RMSE, bias, and number of instantaneous observations (N). A 70 day running mean low pass filter was applied to both time series. Note: buoy time series shows close agreement with altimeter-derived surface geostrophic current at seasonal time scales. This suggests that altimetry is reliable for synoptic/baroptropic variation characterization. As expected, significant discrepancies still exist, with likely explanation tied to ageostrophic parts (i.e. baroclinic and Ekman currents), Gulf Stream rings, and remaining high-frequency aliasing. Vg at Track 65 Fig 5. (top) Hovmuller plot of Vg on Track 100; (a) Time series of the altimeter current Vg in the zones: (blue) inner shelf < 100m; (red) shelf edge 100-1000m in isobaths). (b)&(c) anomaly time series of Vg at the shelf edge and at the inner shelf, respectively. Fig 4. 1992-2014 Time series of the altimeter derived cross-track current Vg (negative is SW flow anomaly) for passes 100, 024, 202 and 065 (from top to bottom) at the shelf-edge (across100-1000m isobaths). See altimeter track locations in Fig 1. • V. Observed Subsurface GoMaine Salinity variability • V.I. GoM salinity variability tied to Altimeter-informed Scotian Shelf Inflow Inter-annual Variability Seasonal Variability (b) Buoy L: Max R=0.78@ lag=30days Salinity Buoy L: Max R=0.66 Salinity Salinity Vg at T100 Vg at T100 (a) Buoy M: Max R=0.67@ lag=50days Buoy M: Max R=0.48 Vg at T100 Salinity Salinity Salinity Vg at T100 Buoy I: Max R=0.72@ lag=80days Buoy I: Max R=0.51 Vg at T100 Salinity Salinity Vg at T100 Time lag (days) • Fig. 10. Time lagged cross-correlations between the buoy (B, E, I, M, L, and N) observed salinity at the 50m depth and the altimeter-derived alongshelf current Vg at Track 100 (Scotian Shelf: Full shelf). Positive time lag indicates Vg leads. • Vg on Scotian Shelf explains the salinity variability significantly well. The time lags indicate Vg leads salinity with estimated advection speed for 6-10 cm/s. • Clearly altimeter Vg can be used as a measure of SSW inflow into the GoM in the SS-GoM system. • Figure 8. Seasonal climatology representing annual cycle of salinity (a) at 50 m and (b) at 1m depth at buoys L, I, M (Jordan’s Basin), E, B and N orge’s Basin, near the NEC east) (Figure 2). • Features summarized as follows: • A seasonal cycle in salinity is apparent ( excepting N) • Counter-clock-wise advection around interior coastal GoM at 50m depth (L, I,E,B), where Buoy I lea ~ 40 days. The distance between I and B is about 210km, advection is at a speed of ~6-7 cm/s. • But surface (1m) salinity is nearly zero lag. This implies that at 50m the remotely forced advective flow is significant ( also see Fig.10). Buoy B: Max R=0.71@ lag=120days Buoy B: Max R=0.49 Vg at T100 Salinity Vg at T100 Salinity Fig. 11. Anomaly ( monthly means removed) time series of (left y-axis) the 50m salinity at Buoy L, M, I, B( top to bottom) and (right y-axis) anomalies of the altimeter-derived along-shelf velocity anomaly Vg at track 100 ( full shelf ). (Negative Vg represents southwestward flow) Fig. 9. Time series of (left y-axis) the 50m salinity at Buoys L, M, I, B ( from top to bottom) and (right y-axis) the lagged altimeter-derived alongshelf velocity anomaly Vg from track100 (full shelf ). (Negative Vg represent southwestward flow) (see buoy sites in Fig.2) Fig. 7. (a) Time series of observed salinity at 50m depth at buoys B, I, E, M (Jordan’s Basin), L, and N( George’s Basin; and (b)/(c)/(d)/(e)/(f)/(g) time series of salinity anomaly at 50m at buoy B, I,E,M,L, and N respectively. A 70 day running mean low pass filter was applied to all time series • References • Feng, H. and D. Vandemark, 2011. Altimeter Data Evaluation in the Coastal Gulf of Maine and Mid-Atlantic Bight Regions, Marine Geodesy, 34:3-4, 340-363. • Mountain and Manning, Seasonal and interannual variability in the properties of the surface waters of the Gulf of Maine, Continental Shelf Research, Vol. 14, No. 13/14, pp. 1555-1581, 1994 • Smith, P.C., R.W. Houghton, R.G. Fairbanks and D.G. Mountain. 2001. Interannual variability of boundary fluxes and water mass properties in the Gulf of Maine and on Georges Bank: 1993-1997. Deep Sea Res.-II, 48(1-3): 37–70. • Townsend, D.W., N.R. Pettigrew, M.A. Thomas, M.G. Neary, D.J. McGillicuddy, Jr. and J. O'Donnell. 2014. Water masses and nutrient fluxes to the Gulf of Maine. Journal of Marine Research • Acknowledgements • NASA’s Science Directorate Physical Oceanography Program • University of Maine buoy measurement program, NERACOOS, NOAA IOOS, DFO • V.II. Summary • Altimeter-based geostrophic velocities at critical locations in the Scotian Shelf – Gulf of Maine system are validated using buoy measurements. Validation results are encouraging, showing that altimetry Vg is reliable for synoptic variation characterization (Fig. 3) • Key findings include • Altimeter-based alongshore Vg at Track 100 can be used as a proxy for SSW inflow variation into the GoM, explaining a significant GoM 50-m salinity • variability on seasonal and inter-annual time scales. Specifically, • for the seasonal scale, the maximum correlations are in 0.6-0.8 (explaining about 36-64% variance ) with an estimated advection speed of SSW inflow • along the GoM coastal zone calculated at 5-8 cm/s (and confirmed with buoy ADCP data) ( Fig 8 and Fig10). • for the inter-annual time scale, the max correlations are in 0.45-0.6 (explaining about 25-35% variance ). • Altimeter-based alongshore current variation had shown to respond to downwelling (storms) with a spread in forcing wind direction (Fig. 6). 8th Coastal Altimetry Workshop, Konstanz, Germany, 23-24 October, 2014 ct