Download
1 / 25
350 likes | 1.32k Views
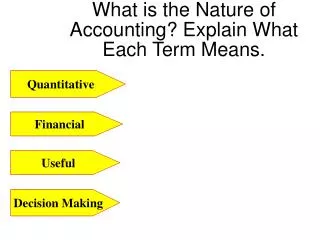
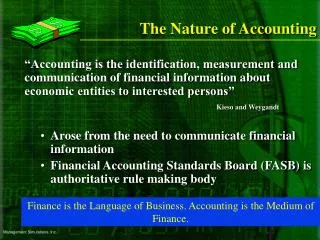
The Nature of Accounting. “Accounting is the identification, measurement and communication of financial information about economic entities to interested persons” Kieso and Weygandt Arose from the need to communicate financial information

E N D
The Nature of Accounting “Accounting is the identification, measurement and communication of financial information about economic entities to interested persons” Kieso and Weygandt • Arose from the need to communicate financial information • Financial Accounting Standards Board (FASB) is authoritative rule making body Finance is the Language of Business. Accounting is the Medium of Finance.
Underlying Assumptions Key Assumptions • Double entry • Timing-matching principal • Accrual accounting • Historical cost • FASB Standards applied to simulation reports.
Objectives of Financial Reporting • Know how effectively resources are obtained and appropriated • Use information to inform investment and credit decisions • Identify optimum time to take actions affected by cash flow P&L or Income Statement Balance Sheet Cash Flow
Balance Sheet • Identifies what the company owns and who owns it • Snapshot of financial health • Assets always equal liabilities and net worth combined • Accurate for a specific date
Sample Capstone ® Balance Sheet from Annual Reports • Provides two year’s data • Leverage = Total Assets / Total Equity. Ideal Leverage 1.81 to 2.80 – from shareholder’s perspective • Lenders prefer to examine Debt / Assets • Managers favor Debt / Equity The Analyst Report on the website provides coaching on Financial Structure
Capstone ® Balance Sheet Survey The Capstone ® Courier provides each team’s Balance Sheet summary on Page 3 Strategic intentions may be inferred based on profile Example – a team with a large Plant & Equipment line may be adopting a cost leadership, high volume position
Profit and Loss Statement or Income Statement • Compares revenues and expenses for a given period • Movie of financial health • Shows activity over a period of time • Indicates the profitability of an organization
Income Statement Survey from Capstone ® Courier • Compare your team against competitors • Is your variable costs to sales comparison above or below average? • Do your SG&A expenses relative to sales reflect good rates of return?
Simulation Sample Proforma Income Statement Your spreadsheet program creates a Proforma Income Statement using your sales forecasts reconciled to your tactical decisions The projected loss for net profit in this example tells the management team there is additional work to be done in the Strategy section Red number – bad, black number - good
Cash Flow Statement • Shows movement of cash in and out of an organization over a given period • Shows how much cash is available for use during a given period • Reconciles net profit back to cash
Sample Capstone ® Cash Flow Statement • Provides two year’s data • Common causes for emergency loans: • Excessive inventory resulting from poor sales forecasts • Making Plant & Equip upgrades w/o raising sufficient capital • Operating losses
Introduction to Ratios • A financial ratio shows the relationship between two financial measures • Developed by dividing one measure into another • Provide insights into company’s operations and strategy • Four categories: liquidity, solvency, market value, profitability • Used internally to evaluate performance and set goals • Used externally to make investment decisions
Ratios Report Sample from Spreadsheet Proformas Your spreadsheet program creates a Proforma Ratios Report based on your sales forecasts and tactical decisions. Are your decisions maximizing the Success Measurements (ROE, ROS, ROA, Stock Price, Asset Turnover, Market Capitalization) you chose (or were assigned)?
Asset Turnover “Reveals how effective assets are at generating sales revenue.” sales assets Asset Turnover =
Return on Sales “ROS indicates the percentage of each sales dollar that results in net income.” net profit net sales Return on Sales =
Return on Assets “ROA measures a company’s ability to use all its assets to generate earnings.” net profit assets Return on Assets =
Leverage “Leverage shows the debt level of the organization.” assets equity Leverage =
Return on Equity “Return on Equity highlights for the stockholders the return on their investment.” net profit equity Return on Equity =
Du Pont Formula Value Chain net profit equity Return on Equity = net profit sales sales assets assets equity x x
net profit equity Return on Equity = net profit sales sales assets assets equity x x Du Pont Formula Value Chain
Du Pont Formula Value Chain net profit equity Return on Equity = net profit sales sales assets assets equity x x Return on Sales Asset Turnover Leverage
Du Pont Formula · TI vs. HP Current Assets = 1.29 Fixed Assets = 1.11 Sales = 4.07 Net Income = .37 Shareholder Equity = 1.16 Texas Instruments Hewlett Packard
Du Pont Formula · TI vs. HP Current Assets = 1.29 Fixed Assets = 1.11 Sales = 4.07 Net Income = .37 Shareholder Equity = 1.16 Turnover x 1.69 ROS 9.3% = ROA 15.7% x Leverage 2.07 = ROE 32.5% Texas Instruments Hewlett Packard
Du Pont Formula · TI vs. HP Current Assets = 1.29 Fixed Assets = 1.11 Sales = 4.07 Net Income = .37 Shareholder Equity = 1.16 Current Assets = 1.49 Fixed Assets = .84 Sales = 3.09 Net Income = .52 Shareholder Equity = 1.54 Turnover x 1.69 ROS 9.3% = ROA 15.7% x Leverage 2.07 = ROE 32.5% Texas Instruments Hewlett Packard
Du Pont Formula · TI vs. HP Current Assets = 1.49 Fixed Assets = .84 Sales = 3.09 Net Income = .52 Shareholder Equity = 1.54 Current Assets = 1.29 Fixed Assets = 1.11 Sales = 4.07 Net Income = .37 Shareholder Equity = 1.16 Turnover x 1.69 ROS 9.3% = ROA 15.7% x Leverage 2.07 = ROE 32.5% Turnover x 1.33 ROS 16.9% = ROA 22.4% x Leverage 1.52 = ROE 33.8% Texas Instruments Hewlett Packard