Download
1 / 20
200 likes | 402 Views
Directional Difference of Satellite Land Surface Temperature Yunyue Yu NOAA/NESDIS/STAR. Outline. Research Motivation Concept of the Directional Effect Directional Effect Observed in Polar-orbiting Satellite Data Directional Effect Observed in Geostationary Satellite Data

E N D
Directional Difference of Satellite Land Surface Temperature Yunyue Yu NOAA/NESDIS/STAR
Outline • Research Motivation • Concept of the Directional Effect • Directional Effect Observed in Polar-orbiting Satellite Data • Directional Effect Observed in Geostationary Satellite Data • Possible Solutions?
Research Motivation Is Directional LST Difference Significant ? • Affect to LST validation process • Affect to produce climate data record • Affect to LST applications, e.g. data assimilation for forecast model
Sunlit Crown Shaded Crown Sunlit Background Shaded Background Concept of the Directional Effect One of directional effect described by Modified Geometric Projection Model k=N endmembers X: fraction of the cover probability e: emissivity of the endmember T: temperature of the endmember Four endmembers: Sunlit Crown, Shaded Crown Sunlit background, Shaded Background
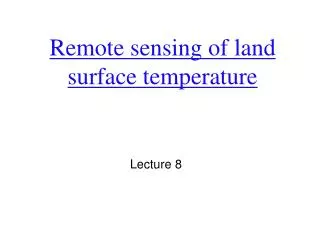
Apparent LST Apparent Emissivity The vegetation coverage is 60%. The vegetation coverage is 30%. Concept of the Directional Effect MGP Model Run Example Examples of the surface temperature distributions and the mean emissivity distributions (solid line) along with the satellite view zenith angle. The temperature and emissivity distributions are calculated from the MGP model temperature settings, for solar zenith angle at 0, 30 and 60 degrees, respectively; the LAI value is 1.
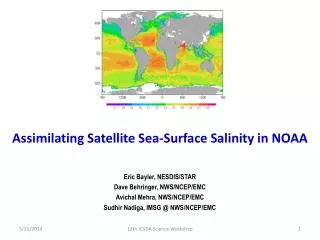
Daily daytime AVHRR a) Land surface temperature and b) View zenith angle. [Pinheiro et al., Remote Sensing of Environment, 103 (2006)] Directional Effect Observed in AVHRR Data Daytime AVHRR, LST observations, at Ghanzi, Botswana Demonstrated LST variability is a combination of:a) residual atmospheric effects b) real aggregate temperature differences c) emissivity angular variability
Directional Effect Observed in Geostationary Satellite Data GOES-8 and GOES-10 Imager data were aqpplied in validating LST algorithm using ground data from SURFace RADiation (SURFRAD) budget network stations Duration of Data: Jan 1 – Dec 31, 2001
Two-directions from GOES Satellites 135° W 75°W
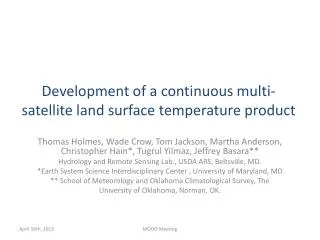
LST Directional Effect in GOES-8 and -10 Imager Difference of LSTs observed by GOES-10 and GOES-8 imager at the same location of SURFRAD station Desert Rock, NV, 36.63ºN, 116.02ºW. The simultaneous observation pairs are about 2096. View zenith of GOES-8: 60.140 View zenith of GOES-10: 46.810
LST Directional Effect in GOES-8 and -10 Imager (2) Goodwin Creek, MS, observation pairs are about 510. View Zenith of GOES-8/-10: 42.680/61.890
LST Directional Effect in GOES-8 and -10 Imager (3) Boulder, CO, observation pairs are about 510. View Zenith of GOES-8/-10: 42.680/61.890
Fort Peck, MT. Data pairs: 912 Bondville, IL. Data pairs: 710 View Zenith of GOES-8: 62.420 View Zenith of GOES-10: 62.360 View Zenith of GOES-8: 48.120 View Zenith of GOES-10: 66.140 LST Directional Effect in GOES-8 and -10 Imager (4) Note the difference of the two sites
Summary • Summary • LST directional effect were observed from Polar-orbiting satellite data (NOAA/AVHRR) and Goestationary satellite data (GOES/Imager) • LST difference due to the viewing angle difference changes diurnally; the effect during daytime is considerable bigger than that is during nighttime. • The satellite LST uncertainty due to the directional effect is considerably larger comparing to the requirement, and cannot be ignored (particularly during the daytime). • VIIRS/LST should provide correction/complimentary information on it after the launch (do work from now).
Sample of common area observed by GOES-E, GOES-W and POES satellites. LSTs derived from those satellite data will be used to develop an unified LST algorithm. Possible Solution? Different satellite observations over common areas can be calibrated each other for the data consistency.
SURFRAD Network Systematic Differences, ºC D , i,j Station Name GOES - 8 - SURFRAD GOES - 10 - SURFRAD GOES - 10 – GOES - 8 D D D 2,1 3,1 3,2 Goodwin Creek, MS 0.4 - 0.3 - 0.8 Desert Rock, NV - 3.2 - 2.3 0.9 Bondville, IL - 0.1 - 1.4 - 1.3 Boulder, CO - 1.1 - 1.2 - 0.2 F ort Peck, MT - 0.8 - 1.1 - 0.3 AVERAGE - 1.0 - 1.3 - 0.3 WE CAN TRY TO USE NIGHTTIME OBSERVATION TO EVALUATE SYSTEMATIC ERRORS IN LST Mean differences Δi,j between nighttime observed LST. Let us consider that nighttime LST observation at five selected SURFRAD stations is unbiased. In such assumption all GOES-8 observed LST should be corrected by adding constant bias ~1.0 ºC, and all GOES-10 observed LST should be corrected by adding constant bias ~1.3 ºC. This table will be recomputed!