Download
1 / 40
400 likes | 568 Views
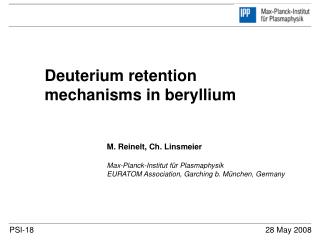
Deuterium retention mechanisms in beryllium. M. Reinelt, Ch. Linsmeier Max-Planck-Institut für Plasmaphysik EURATOM Association, Garching b. München, Germany. PSI-18 28 May 2008. Outline. Motivation Results of thermal release experiments Variation of ...

E N D
Deuterium retention mechanisms in beryllium M. Reinelt, Ch. Linsmeier Max-Planck-Institut für Plasmaphysik EURATOM Association, Garching b. München, Germany PSI-18 28 May 2008
Outline • Motivation • Results of thermal release experiments Variation of ... * Irradiation fluence * Implantation temperature * BeO coverage • Modeling Energy diagram of D / Be • Conclusion ITER cross section
Motivation Be: ~700 m2 D implantation into beryllium Deuterium retention / thermal recycling of ITER main wall Be : Fast reaction with O2 / H2O Previous experiments : BeO contaminated surfaces Investigation of System Be (+BeO) / D Clean Be / D : NO DATA ! D,T
Be (+ BeO) 1 and 1.5 keV D implantation Motivation Be: ~700 m2 [Anderl et al. 1999] D,T Variation by 1 ORDER OF MAGNITUDE !
Concept • Possible reasons: • Undefined BeO coverage • Undefined crystallinity • Unclear retention mechanisms • (Needed for quantification) • Issues to be solved: • Retention in pure Be ? • Crystallinity • Influence of BeO ? • Retention mechanisms ?
Experimental concept in situ... (10-11 mbar) Ar sputter cleaning+ annealing XPS / LEIS: Control of surface TPD Temperature Programmed Desorption • Sequential release of D • Limited by combination of • bulk + surface • processes • Energy barriers for ... • Diffusion • Detrapping • Recombination Thermal release NRA • Retention • mechanisms 1 keV D implantation • Hydrogen • retention Single crystalline Be
TPD: Spectrum • 1 keV D+ Implantation (300 K) • 2·1017 D cm-2 Sequential release: Energetically different rate limiting steps m/q= 4 (D2)
TPD: Increasing fluence TPD Spectra recorded in random order ! Fluence dependent behaviour
TPD: Increasing fluence Trapping in ion induced defects
TPD: Increasing fluence Structural modifications Trapping in ion induced defects Local saturation of available binding sites
TPD: Increasing fluence Structural modifications Sample saturation Threshold
Retention: Simulation by SDTrim.SP Super saturation zone D accumulation in a depth of 40 nm Bulk saturation concentration: 26 at% D (D/Be = 0.35) * Supersaturation * Structural modifications: Surface process? (cut off) SDTrim.SP Calculation TPD Experiments
Structural modifications / Surface desorption 1st order release 1 DTrapped DMobile 2nd order release 2 D D2 (Surface desorption)
Structural modifications / Surface desorption * Peak shape Desorption peak is 1st order * Surface area (AFM) Release of 60 x Θ (saturation coverage Θ~ 0.5) AFM: max. 1.2 Θ Surface recom-bination is not the rate-limiting step
TPD: Influence of BeO-coverage No change of EA of release from binding states No recombination limit ↔ Trapping in the bulk Formation of BeO-D at the surface BeO:D (surface)
TPD: Elevated implantation temperatures 530 K 300K
TPD: Elevated implantation temperatures Different retention mechanism ! Change of the binding states in the supersaturated areas Ion-induced trap sites unaffected 300K 530 K
TPD: Elevated implantation temperatures Different retention mechanism ! Change of the binding states in the supersaturated areas BeD2 formation (Decomposition ~ 570 K) BeO:D (surface) Ion-induced trap sites unaffected BeD2 300K 530 K
Implanted / Co-deposited 300 K 1 keV Ion implanted (this work) D/Be plasma co-deposited (de Temmerman)
Implanted / Co-deposited 300 K 1 keV Ion implanted (this work) D/Be plasma co-deposited (de Temmerman) Supersaturated material
Implanted / Co-deposited 300 K 1 keV Ion implanted (this work) D/Be plasma co-deposited (de Temmerman) Ion-induced traps in the bulk
Implanted / Co-deposited Formation of BeD2 see also poster P3-05 by R. Doerner 300 K 600 K 530 K
Qualitative interpretation of data Ion-induced traps in the bulk lattice Structural modifications BeD2 ~ Constant retention Be (+ BeO) 1 and 1.5 keV clean Be (1 keV) [Anderl et al. 1999] 300 400 500 600 700 800 900 1000 Specimen exposure temperature [K]
Identification of retention mechanisms Quantification: TMAP7 / Rate equations
TMAP7: D transport bulk / surface • Input parameters • Trap concentration • profile by SDTrim.SP • Saturated trap sites (TPD) • Temperature ramp (TPD) • Literature: • Diffusion barrier 0.29 eV • Dissolution energy 0.1 eV • Free parameters Detrapping energies ET1 = 1.88 eV ET2 = 2.05 eV
Schematic energy diagram TPD – Spectrum Activation energies Atomic D E0≡ 0 0 Position / State E (D-Atom) Temperature [K] Desorption rate [a.u.]
Schematic energy diagram Positions in the undisturbed bulk lattice E (D-Atom) Mobile state [ΔED = 0.29 eV] Atomic D E0≡ 0 [ES = -0.10 eV] Temperature [K] Desorption rate [a.u.]
Schematic energy diagram Surface processes E (D-Atom) Mobile state [ΔED = 0.29 eV] Atomic D E0≡ 0 [ES = -0.10 eV] [ΔEAd = 0.87 eV] Temperature [K] Molecular D2 [EBE (1/2 D2) = -2.278 eV] Surface Desorption rate [a.u.]
Schematic energy diagram Activation energies obtained from modeling of TPD spectra E (D-Atom) Mobile state [ΔED = 0.29 eV] Atomic D E0≡ 0 [ES = -0.10 eV] [ΔEAd = 0.87 eV] Temperature [K] Molecular D2 [EBE (1/2 D2) = -2.278 eV] Surface Desorption rate [a.u.]
Schematic energy diagramm Activation energies obtained from modelling of TPD spectra E (D-Atom) Mobile state [ΔED = 0.29 eV] Atomic D E0≡ 0 [ES = -0.10 eV] [ΔEAd = 0.87 eV] ΔE = 1.25 eV 1.33 eV BeD2 Temperature [K] Molecular D2 [EBE (1/2 D2) = -2.278 eV] ΔE = 1.88 eV 2.05 eV Surface Desorption rate [a.u.] Ion-induced defects Supersaturated states
Conclusion • Deuterium retention in beryllium • Binding states / retention mechanisms identified and quantified • Hydrogen retention in ITER: negligible contribution of "pure" Be wall (< 7 g T by implantation) • Thin BeO surface layers are not rate-limiting for thermal recycling • Formation of BeD2 at elevated temperatures • Currently: DFT calculations Detailed understanding of D / Be
Surface desorption ? Literature data [Lossev,Küppers 1993]
Substrate characterization: SEM Cleaning: Cycles of 3 keV Ar+ / 1000 K Recrystallization + erosion
Substrate characterization: SEM SEM (1010) (1120) • T 1000 K, several hours: • Recrystallization to low • indexed facets
Substrate characterization: AFM AFM 500 nm • Cycles of • Cleaning • D Implantation • Degassing 1000 K • Recrystallization • Erosion • D Induced structural modifications
SEM: bubble & channel formation ? This work: Anderl et al. [1992]: Fluence≤ 4·1017 D cm-2 CLOSED nanosized structural modifications ! Higher fluences Const. retention Aggregation ! Bubbles, pores, OPEN channels
Chemical surface composition XPS cleaned & annealed • Cleaning by Ar+ • bombardment • Annealing 1000 K • BeO coverage < 0.2 ML • < 1day (10-11 mbar) • > 1000 K