1 / 8

Teacher Absence Data

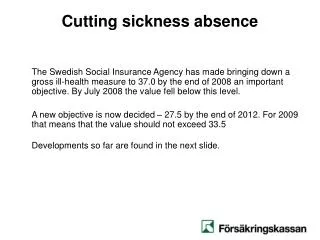
Analyzing the 2012-2013 teacher absence data reveals a concerning increase in "unfilled" rates compared to historical statistics. Teachers subbing during prep time and challenges with extra students during emergency subs highlight contractual issues. Explore strategies to manage total teacher absences, comparison to district-directed rates, building-specific insights, and leave of absence corrections. Share your thoughts on addressing this crucial issue.

ciara
Download Presentation

Teacher Absence Data

An Image/Link below is provided (as is) to download presentation Download Policy: Content on the Website is provided to you AS IS for your information and personal use and may not be sold / licensed / shared on other websites without getting consent from its author. Content is provided to you AS IS for your information and personal use only. Download presentation by click this link. While downloading, if for some reason you are not able to download a presentation, the publisher may have deleted the file from their server. During download, if you can't get a presentation, the file might be deleted by the publisher.

E N D

Presentation Transcript


  1. Teacher Absence Data Quarters 1-3, 2012-2013

  2. At Issue • Lack of subs • Increase in “unfilled” rates • Historically: 97-100% • 2012-13: • Sep – 96% • Oct – 91% • Nov – 93% • Dec – 89% • Jan – 90% • Feb – 90% • March - 92% • Teachers subbing during their prep time • Taking on extra kids in current classes on emergency sub times • Contractual issues with subbing outside of prep time

  3. Absence Data – Teacher vs District Directed

  4. Total Teacher Absences (Day of the Week)

  5. Comparison Teacher/District Directed (Qtr 1-3)

  6. Teacher Absences (Building)

  7. Corrected - Leaves of Absences

  8. Thoughts?

More Related