Download
1 / 35
350 likes | 424 Views
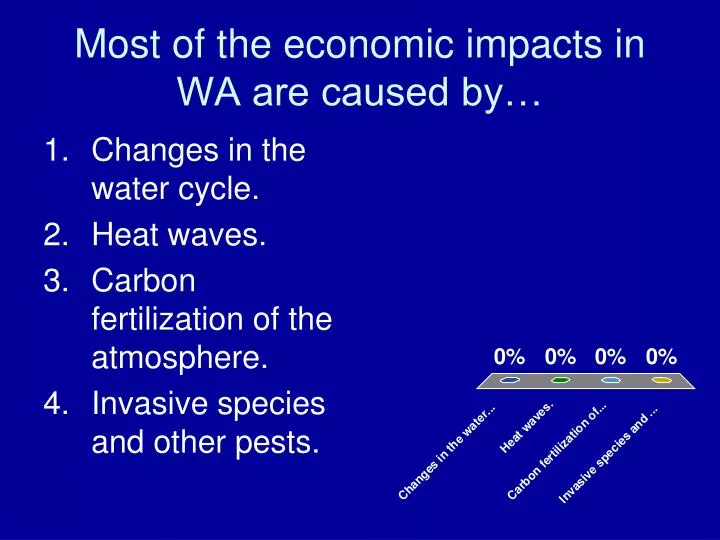
Most of the economic impacts in WA are caused by…. Changes in the water cycle. Heat waves. Carbon fertilization of the atmosphere. Invasive species and other pests. What was the “errata for the HB3103 Interim Report” about?. Feet versus cm. Degrees C versus degrees F.

E N D
Most of the economic impacts in WA are caused by… • Changes in the water cycle. • Heat waves. • Carbon fertilization of the atmosphere. • Invasive species and other pests.
What was the “errata for the HB3103 Interim Report” about? • Feet versus cm. • Degrees C versus degrees F. • 50 years versus 100 years. • Tons versus metric tons
Preliminary estimates of economic impacts of climate change in Washington State Produced by Climate Leadership Initiative for the WA Departments of Ecology and CTED, Dec. 2006
British Columbia Washington State
Washington State Whatcom Seattle Walla Walla Yakima
Climate drivers • Increased levels of CO2. • Temperatures up 2°F by 2020s and 3°F by 2040s. • Earlier snowmelt. • No significant change in amount of precipitation. • Sea level rise by 2100 of ≈3 inches to 3+ feet.
Forest resources • Climate drivers • Increased levels of CO2. • Temperatures up 2°F by 2020s and 3°F by 2040s. • Earlier snowmelt. • No significant change in amount of precipitation. • Sea level rise by 2100 of ≈3 inches to 3+ feet.
Electricity • Climate drivers • Increased levels of CO2. • Temperatures up 2°F by 2020s and 3°F by 2040s. • Earlier snowmelt. • No significant change in amount of precipitation. • Sea level rise by 2100 of ≈3 inches to 3+ feet.
Municipal water supply • Climate drivers • Increased levels of CO2. • Temperatures up 2°F by 2020s and 3°F by 2040s. • Earlier snowmelt. • No significant change in amount of precipitation. • Sea level rise by 2100 of ≈3 inches to 3+ feet.
Agriculture Flow of Yakima River Yakima Basin • Climate drivers • Increased levels of CO2. • Temperatures up 2°F by 2020s and 3°F by 2040s. • Earlier snowmelt. • No significant change in amount of precipitation. • Sea level rise by 2100 of ≈3 inches to 3+ feet.
Agriculture Dairy • Climate drivers • Increased levels of CO2. • Temperatures up 2°F by 2020s and 3°F by 2040s. • Earlier snowmelt. • No significant change in amount of precipitation. • Sea level rise by 2100 of ≈3 inches to 3+ feet.
Agriculture Dairy • Climate drivers • Increased levels of CO2. • Temperatures up 2°F by 2020s and 3°F by 2040s. • Earlier snowmelt. • No significant change in amount of precipitation. • Sea level rise by 2100 of ≈3 inches to 3+ feet.
Agriculture Wine • Climate drivers • Increased levels of CO2. • Temperatures up 2°F by 2020s and 3°F by 2040s. • Earlier snowmelt. • No significant change in amount of precipitation. • Sea level rise by 2100 of ≈3 inches to 3+ feet. Source: Dr. Gregory V Jones, Southern Oregon Univ. Source: Greg Jones, Southern Oregon Univ.
Other potential impacts • Flooding: higher risk in some areas, lower risk in others. • Public health: West Nile Virus, asthma, heat-related deaths, etc. • Snow sports: Shorter, rainier seasons. • Salmon and fisheries: Warmer water threatens salmon; other effects unknown. • Shorelines: May need to redesign or rebuild levees, seawalls, etc. • Cumulative impacts and linkages • Risk of catastrophic climate change
Economic impacts this century will likely be visible but manageable • Costs related to forest fires may double by 2040s ($10s to $100s of millions). • Hydropower impacts probably < 5% of revenues (≈$150 million) unless precipitation changes. • By mid-century, drought costs in Yakima up from $13 million to $79 million, milk production down 1-3% ($10s of millions out of ≈ $1 billion sector). • Municipal water systems: Seattle may hit capacity constraint in 2050, not 2060. • WA GDP > $250 billion; state budget ≈ $20 b.
Economic impacts this century will likely be visible but manageable • Key words: this century. Economic impacts will almost certainly increase in future centuries with more warming. • Key word: Likely. In other words, based on what scientists and economists know for sure (or are very confident in), impacts this century will be visible but manageable. • But there are uncertainties (e.g., nonlinear changes) that could make economic impacts this century much, much worse.
Ecosystem thresholds: the case of the Mountain Pine Beetle • a massive outbreak of the mountain pine beetle in BC has killed 100 billion board feet (approx. 9 years of harvest) • low temperatures (< -10°F) limit beetle activity • a recent lack of extreme cold, killing temperatures has allowed the beetle to thrive in epidemic numbers beetle killed pines in BC Photos from http://www.for.gov.bc.cal
Sea level rise (IPCC 2007), “excluding rapid dynamical changes in ice flow.” 1 ft ≈ 300 mm
Sea level rise (IPCC 2007), “excluding rapid dynamical changes in ice flow.” • IPCC 2007: “Larger values cannot be excluded, but understanding of these effects is too limited to assess their likelihood or provide a best estimate or an upper bound for sea level rise.” • Hansen 2007 (not IPCC!): “As a physicist, I find it almost inconceivable that [business as usual] climate change would not yield a sea level change of the order of meters on the century timescale.”
Blue: 2 ft (≈0.6m) Purple: 20 ft (≈6m) Red: 40 ft (≈12m)
Sea level rise (IPCC 2007), “excluding rapid dynamical changes in ice flow.” 1 ft ≈ 300 mm
Sea level rise by 2100 (global plus local ocean dynamics and local tectonic forces) Updated “best guess” from Mote et al. 2008 (“Sea Level Rise in the Coastal Waters of Washington State”) WA. Dept of Ecology
World CO2: from 21,000MMTin 1990 to 44,000MMT in 2030 Source: U.S. Energy Information Administration, Annual Energy Outlook 2006
Washington CO2 (+ other GHG): from 78MMT in 1990 to ??? Source: Based on Dept. of Community, Trade and Economic Development
What was the #1 recommendation from the Climate Action Team? • Fuel economy standards. • Ban coal. • Market-based instruments. • Home energy efficiency.
Net benefits of replacing $100 in sales tax with… income tax Income quintile
Net benefits of replacing $100 in sales tax with… tax on natural gas Income quintile
Net benefits of replacing $100 in sales tax with… tax on electricity Income quintile
Net benefits of replacing $100 in sales tax with… tax on fuel oils Income quintile
Net benefits of replacing $100 in sales tax with… tax on gasoline Income quintile
Net benefits of replacing $100 in sales tax with… tax on jet fuel Income quintile
Net benefits of replacing $100 in sales tax with… income tax Income quintile