Download
1 / 21
210 likes | 339 Views
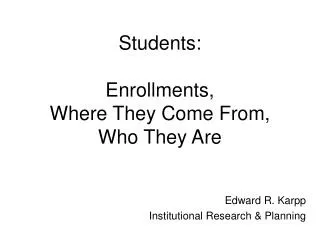
Students: Enrollments, Where They Come From, Who They Are. Edward R. Karpp Institutional Research & Planning. FTES. GCC Student Enrollments. 2006-2007 Credit: 12,819 Noncredit: 2,665 Total: 15,484. High School Graduates. Credit Student Origins.

E N D
Students:Enrollments,Where They Come From,Who They Are Edward R. Karpp Institutional Research & Planning
FTES GCC Student Enrollments 2006-2007 Credit: 12,819 Noncredit: 2,665 Total: 15,484
High School Graduates Credit Student Origins GCC’s College Share of High School Graduates:Percentage of high school graduates from a particular high school attending any community college as a first-time freshman who attend GCC (2003, 2004, 2005) Example:Glendale HS 668 first-time freshmen under 19 from GHS at GCC = 67% 998 GHS graduates entered a community college
High School Graduates Credit Student Origins GCC Does Regular Outreach to the Following High Schools:
High School Graduates Credit Student Origins Glendale Main Campus Pasadena Garfield Campus LA Valley LA City Santa Monica East LA
High School Graduates Credit Student Origins
High School Graduates Credit Student Origins Identifying high schools for outreach
High School Graduates Credit Student Origins • Why Do Students Choose Other Colleges? • Questions to Explore: • Less time to transfer-level courses? • Family desires? • Easier transportation (e.g., direct bus routes)? • More flexible methods of instruction (e.g., online)? • Variety of programs? • To be with new people?
College-Going Students By Residence ZIP Code Credit Student Origins GCC’s College Share by Residence ZIP Code:Percentage of people from a particular ZIP code attending any community college who attend GCC (Fall 2005 & 2006) Example:ZIP Code 91205 6,228 people from 91205 attended GCC = 85% 7,364 people attended a community college
College-Going Students by Residence ZIP Code Credit Student Origins 80% or higher 70% to 79% 60% to 69% 50% to 59% 40% to 49% 30% to 39% 20% to 29% 10% to 19% 0% to 9% Main Campus Garfield Campus
By Applicant Yield Credit Student Origins Applicant Yield:Percentage of first-time applicants who register for classes (Fall 2004, 2005 & 2006)
By Applicant Yield Credit Student Origins Main Campus 77% or higher 70% to 76% 63% to 69% Garfield Campus 56% to 62% 49% to 55% 42% to 48% 35% to 41% 28% to 34% 21% to 27% 14% to 20% 0% to 13% <10 applicants
Ethnicity Credit Student Demographics 2007 Armenian: 35% Latino: 25% Anglo: 15% Asian/Pac Isl: 11%
Gender Credit Student Demographics 2007 Male: 42% Female: 58%
Age Credit Student Demographics 2007 Under 25: 58% 25 & Over: 42%
District Status Credit Student Demographics 2007 GCCD: 46% LACCD: 41% Other Districts: 5% Outside CA: 8%
Majors Credit Student Demographics
Noncredit Student Demographics • GCC offers about 120 noncredit courses • The Fall 2007 Schedule lists about 350 sections of noncredit courses • Students may take noncredit courses at the Garfield Campus, on the Main Campus, and at many off-campus locations • In Fall 2006, nearly 7,500 students registered in noncredit courses • Noncredit courses generated 2,665 FTES in 2006-2007
Ethnicity Noncredit Student Demographics 2007 Armenian: 36% Latino: 22% Anglo: 17% Asian/Pac Isl: 9%
Gender Noncredit Student Demographics 2007 Male: 29% Female: 71%
Goals (About 7,500 Students) Basic Skills in English/ESL or Math 31% Educational Development/Personal Interest 19% Job Skills 11% Diploma/GED 8% Transfer/Associate Degree 4% Certificate 1% Undecided/Unknown 26% Percentage of Students Enrolled in Each Noncredit Department Noncredit ESL 49% Noncredit Business 18% Lifelong Learning 14% Developmental Skills Lab 11% Parent Education 10% Other 1% Noncredit Student Demographics