Download
1 / 1
10 likes | 155 Views
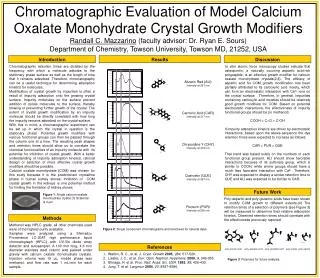
Chromatographic Evaluation of Model Calcium Oxalate Monohydrate Crystal Growth Modifiers Randall C. Mazzarino (faculty advisor: Dr. Ryan E. Sours) Department of Chemistry, Towson University, Towson MD, 21252, USA.

E N D
Chromatographic Evaluation of Model Calcium Oxalate Monohydrate Crystal Growth Modifiers Randall C. Mazzarino (faculty advisor: Dr. Ryan E. Sours) Department of Chemistry, Towson University, Towson MD, 21252, USA Chromatographic retention times are dictated by the frequency with which a molecule adsorbs to the stationary phase surface as well as the length of time that it remains adsorbed. Therefore, chromatography can be a useful technique for determining adsorption kinetics for molecules. Modification of crystal growth by impurities is often a result of impurity adsorption onto the growing crystal surface. Impurity molecules on the surface prevent addition of solute molecules to the surface, thereby slowing or preventing further growth of the crystal. The extent of crystal growth modification by an impurity molecule should be directly correlated with how long the impurity remains adsorbed on the crystal surface. With this in mind, a chromatographic experiment can be set up in which the crystal in question is the stationary phase. Potential growth modifiers with various functional groups can then be passed through the column one at a time. The resulting peak shapes and retention times should allow us to correlate the chemical functionalities of an impurity molecule with its potential for inhibition of crystal growth. With a better understanding of impurity adsorption kinetics, rational design or selection of more effective crystal growth modifiers should be possible. Calcium oxalate monohydrate (COM) was chosen for this study because it is the predominant crystalline phase in human kidney stones. Inhibition of COM crystal growth in the kidneys is one potential method for limiting the formation of kidney stones. Introduction Results Discussion In vitro atomic force microscopy studies indicate that osteopontin, a naturally occuring aspartic acid-rich polypeptide, is an effective growth modifier for calcium oxalate monohydrate crystals(2,3). The efficacy of aspartic acid for COM growth modification has been partially attributed to its carboxylic acid moiety, which can form an electrostatic interaction with Ca2+ ions on the crystal surface. Therefore, in general, impurities containing carboxylic acid moieties should be relatively good growth modifiers for COM. Based on potential electrostatic interactions, the effectiveness of impurity functional groups should be (in methanol): COOH > C=O > C-OH If impurity adsorption kinetics are driven by electrostatic interactions, based upon the above sequence the dye retention times were expected to increase as follows: CAR > PUR > QUE That trend was based solely on the numbers of each functional group present. ALI should show favorable interactions because of its sulfonate group, which is similar to COOH, while amine groups should have a much less favorable interaction with Ca2+. Therefore, CHY was expected to display a similar retention time to QUE and ALI was expected to be similar to CAR. Alizarin Red (ALI) Intensity at 251 nm Carminic Acid (CAR) Intensity at 317 nm Chrysoidine Y (CHY) Intensity at 418 nm Quercetin (QUE) Intensity at 267 nm Poly-aspartic and poly-glutamic acids have been shown to modify COM growth to different extents.(4) The retention times of a selection of polymers (see Figure 3) will be measured to determine their relative adsorption kinetics. Observed retention times should correlate with the effectiveness previously reported. Future Work Figure 1: Single calcium oxalate monohydrate crystal.(1) Scale bar is 3 μm Purpurin (PUR) Intensity at 505 nm Methods Methanol was HPLC grade, all other chemicals used were of the highest purity available. Samples were analyzed using a Shimadzu Prominence LC-20AT high performance liquid chromatograph (HPLC) with UV-Vis diode array detector and autosampler. A 100 mm long, 4.6 mm diameter stainless steel column was packed under gravity with calcium oxalate monohydrate crystals. Injection volume was 15 μL, mobile phase was methanol, and flow rate was 1 mL/min for each sample. Figure 2: Single component chromatograms and structures for several dyes. References • Walton, R. C., et al. J. Cryst. Growth 2005, 284, 517-529. • Lieske, J. C., et.al. Curr. Opin. Nephrol. Hypertens.2000, 9, 349-355. • Shiraga, H. et al. Proc. Natl. Acad. Sci. USA. 1992, 89, 426-430. • Jung, T. et al. Langmuir2004, 20, 8587-8596. poly-acrylic acid poly-aspartic acid poly-glutamic acid poly-lysine poly-serine Figure 3: Polymers for future analysis.