Download
1 / 21
210 likes | 367 Views
Real-time Data Access Monitoring in Distributed, Multi Petabyte Systems. Tofigh Azemoon Jacek Becla Andrew Hanushevsky Massimiliano Turri SLAC National Accelerator Laboratory. Soon a typical running HEP experiment will look like this. 100s of users 10s of thousands of batch nodes

E N D
Real-time Data Access Monitoring in Distributed, Multi Petabyte Systems Tofigh Azemoon Jacek Becla Andrew Hanushevsky Massimiliano Turri SLAC National Accelerator Laboratory Tofigh Azemoon
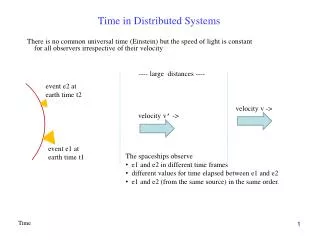
Soon a typical running HEP experiment will look like this 100s of users 10s of thousands of batch nodes 1000s of data servers 10s of millions of files Containing 10s of PB of data + geographically distributed crossing many time zones. Tofigh Azemoon
Mission Statement • Provide real time overall view of system performance • Respond to detailed queries to identify bottle necks to optimize the system to aid in planning system expansion Tofigh Azemoon
The SLAC ¼PB “kan” Cluster Clients Managers bbr-rdr03 bbr-rdr04 Data Servers ( 320 TB) kan059 kan001 kan002 kan003 kan004 Tofigh Azemoon
Monitored Objects user type_2 client type_1 job file session server Tofigh Azemoon
File classes to monitor aggregate values for groups of files BaBar Examples: type_1 ( dataType ) /store/PR/R22/AllEvents/0006/70/22.0.3/AllEvents_00067045_22.0.3V03.02E.root /store/SP/R22/000998/200406/22.0.3/SP_000998_068468.01.root /store/PRskims/R22/22.1.1c/IsrIncExc/79/IsrIncExc_57978.01.root /store/SPskims/R22/22.1.1c/Tau1N/001235/200212/Tau1N_001235_49553.01.root type_2 (skims) File path getFileType ( type_1 value, type_2 value) Tofigh Azemoon
Xrootd Server • Highly scalable server • Posix like access to files • Load balancing • Transparent recovery from server crashes • Fault tolerant • Very low latency Tofigh Azemoon
Minimal impact on client requests Robustness in multimode failure Precision & specificity of collected data Real time scalability Use UDP datagrams Data servers insulated from monitoring. But Packets can get lost Outsource client serialization Low bounded resource usage Use of time buckets Monitoring Implementation in xrootd Tofigh Azemoon
Start Session • sessionId, user, PId, client, server, start T • Staging • stageId, user, PId,client, file path, stage T, duration, server • Open File • fileId, user, PId, client, server, file path, open T • Close File • fileId, bytes read, bytes written, close T • End Session • sessionId, duration, end T • + Xrootd restart time for each server R T d a t a Tofigh Azemoon
Single Site Monitoring Tofigh Azemoon
Multi-site Monitoring Tofigh Azemoon
Collector/Decoder (C++) MySQL database (5.0) Database Applications (Perl, Perl DBI) Create Load Prepare Upgrade Reload Backup Web application ( JSP3) DB access via JDBC Data servers xrootd enabled Database Server Hosting DB & running DB application Web Server Tomcat For security reasons DB & Web servers on different hosts COMPONENTS Tofigh Azemoon
Configuration File • dbName: xrdmon_kan_v005 • MySQLUser: xrdmon • webUser: reader • MySQLSocket: /tmp/mysql.sock • baseDir: /u1/xrdmon/allSites • ctrPort: 9931 • thisSite: SLAC • fileType: dataType 100 • fileType: skim 500 Tofigh Azemoon
site: 1 SLAC PST8PDT 2005-06-13 00:00:00 • site: 2 RAL WET 2005-08-08 10:14:00 • site: 2 CCIN2P3 CET 2006-10-16 00:00:00 • site: 3 CNAF CET 2006-12-18 00:00:00 • site: 3 GRIDKA CET 2006-10-16 00:00:00 • site: 3 UVIC PST8PDT 2007-05-04 21:00:00 • backupInt: SLAC 1 DAY • backupIntDef: 1 DAY Tofigh Azemoon
fileCloseWaitTime: 10 MINUTE • maxJobIdleTime: 15 MINUTE • maxSessionIdleTime: 12 HOUR • maxConnectTime: 70 DAY • closeFileInt: 15 MINUTE • closeIdleSessionInt: 1 HOUR • closeLongSessionInt: 1 DAY • nTopPerfRows: 20 • yearlyStats: ON • allYearsStats: OFF Tofigh Azemoon
Basic View users unique files jobs all files Tofigh Azemoon
Top Performers Table Tofigh Azemoon
User Information Tofigh Azemoon
Skim Information Tofigh Azemoon
Statistics (BaBar, September 2007) • DB size: > 40 GB • # tables: > 200 • many with 10’s of millions rows • Largest table > 132,000,000 rows • # jobs recorded > 30,000,000 • At peak times • over 100 concurrent users • running 10’s of thousands of jobs Tofigh Azemoon
Future Developments & Expansions • DB and RT Data Backup • File and User Filtering • Staging Monitoring • Never enough disk to hold entire data sample • Disk uses power even when files are not accessed • Fraction of Data Accessed • For each file type • In specific time intervals • … • Multi Experiment Monitoring • Many experiments sharing computing resources Tofigh Azemoon