Download
1 / 16
160 likes | 171 Views
Learn how to set up and label graphs in Mrs. Goodman's class, including determining scale, intervals, and axis labels. Understand when to use bar graphs and line graphs for representing data.

E N D
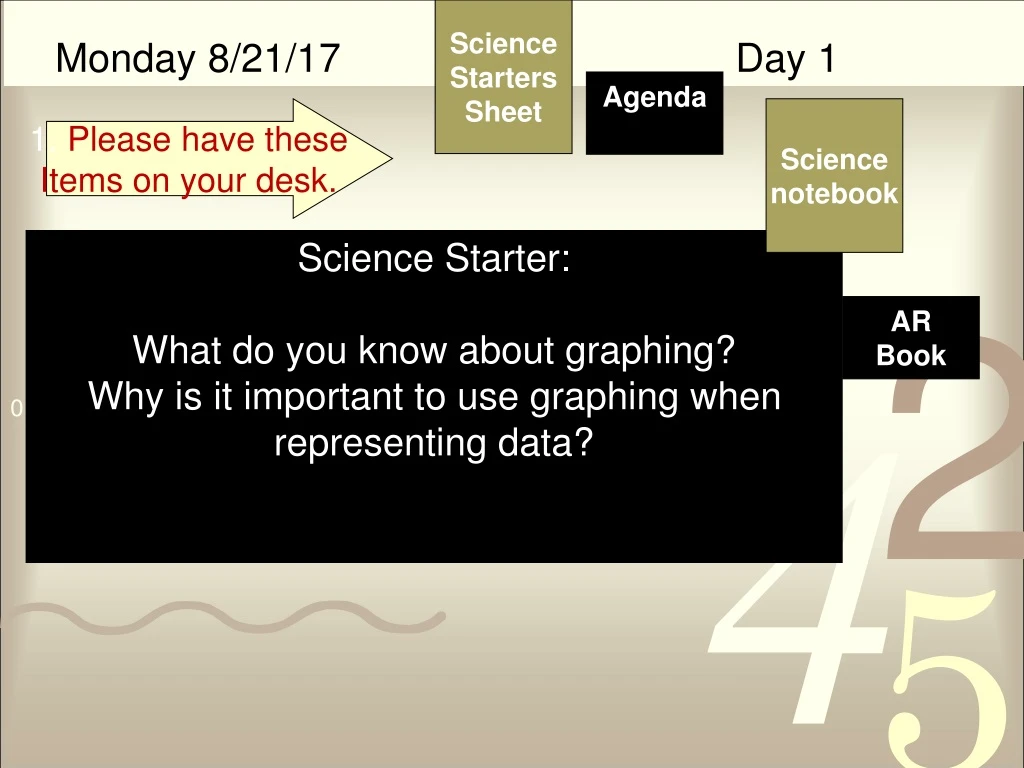
ScienceStarters Sheet Agenda 1. Please have these Items on your desk. Sciencenotebook Science Starter: What do you know about graphing? Why is it important to use graphing when representing data? Monday 8/21/17 Day 1 AR Book
Table of Contents Update Page Date Activity/ Assignment • 8/21 S.F. Graph checklist • 8/21 Graph notes example
Graphs How to set up successful graphs in Mrs. Goodman’s class!
How to set up your graph! Y Axis (This is for your dependent variable)
How to set up your graph! X Axis (This is for your independent variable)
TAILS NFL History - Touchdown Leaders T - Title
TAILS Y Axis = Dependent Variable NFL History - Touchdown Leaders T - Title A - Axis X Axis = Independent Variable
TAILS NFL History - Touchdown Leaders Decide on an appropriate scale for each axis. Choose a scale that lets you make the graph as large as possible for your paper and data T - Title A – Axis S – Scale
Athlete Number of Touchdowns Jerry Rice 208 Emmitt Smith 175 LADAINIAN TOMLINSON 162 Terrell Owens 156 RANDY MOSS 154 How to determine scale • Scale is determined by your highest & lowest number. • In this case your scale would be from 154-208. http://espn.go.com/nfl/history/leaders
Athlete Number of Touchdowns Jerry Rice 208 Emmitt Smith 175 LADAINIAN TOMLINSON 162 Terrell Owens 156 RANDY MOSS 154 How to determine Intervals • The interval is decided by your scale. • In this case your scale would be from 154-208 and you want the scale to fit the graph. • The best interval would be to go by 50’s.
TAILS The amount of space between one number and the next or one type of data and the next on the graph. The interval is just as important as the scale Choose an interval that lets you make the graph as large as possible for your paper and data T – Title A – Axis I – Interval S – Scale
TAILS NFL History - Touchdown Leaders T – Title A – Axis I – Interval S – Scale 250 200 150 100 50 0
LABEL your bars or data points TAILS NFL History - Touchdown Leaders T – Title A – Axis I – Interval L – Labels S – Scale 250 200 150 # of Touch Downs 100 50 0 Emmitt Smith Jerry Rice L.T. Terrell Owens Randy Moss Athlete Label your Y Axis. What do those numbers mean? Give the bars a general label. What do those words mean?
When to use… • Bar graphs • Used to show data that are not continuous. • Allows us to compare data like amounts or frequency or categories • Allow us to make generalizations about the data • Help us see differences in data • Line Graphs • For continuous data • useful for showing trends over time
https://www.youtube.com/watch?v=9BkbYeTC6Mo • Bozeman science