Download
1 / 20
200 likes | 221 Views
Bertrand BESSAGNET (INERIS) on behalf of the EURODELTA team. Main results of the Eurodelta 3 exercise Phase I on criteria pollutants. B. Bessagnet, A. Colette, F. Meleux, L. Rouïl, A. Ung, F. Couvidat (INERIS) P. Thunis (EC JRC) C. Cuvelier (ex. EC JRC) S. Tsyro (Met Norway)

E N D
Bertrand BESSAGNET (INERIS) on behalf of the EURODELTA team Main results of the Eurodelta 3 exercise Phase I on criteria pollutants
B. Bessagnet, A. Colette, F. Meleux, L. Rouïl, A. Ung, F. Couvidat (INERIS) P. Thunis (EC JRC) C. Cuvelier (ex. EC JRC) S. Tsyro (Met Norway) R. Stern (FUB) A. Manders, R. Kranenburg (TNO) A. Aulinger, J. Bieser (HZG) M. Mircea, G. Briganti, A. Cappelletti (ENEA) G. Calori, S. Finardi, C. Silibello (ARIANET) G. Ciarelli, S. Aksoyoglu, A. Prévot (PSI) M.-T. Pay, J. M. Baldasano (BSC) M. García Vivanco, J. L. Garrido, I. Palomino and F. Martín (CIEMAT) G. Pirovano (RSE) P. Roberts, L. Gonzalez (CONCAWE) L. White (AERIS EUROPE) L. Menut (LMD, IPSL, CNRS) J.-C. Dupont (IPSL, CNRS) C. Carnevale, A. Pederzoli (UNBS)
The Eurodelta III exercize • Two phases: • Simulation of intensive measurementcampaigns + EMEP measurements • 1 Jun - 30 Jun 2006 (Summer) • 8 Jan - 4 Feb 2007 (winter) • 17 Sep - 15 Oct 2008 (fall) • 25 Feb - 26 Mar 2009 (winter) • Retrospectiveanalysis (2010, 1999, 1990) Full trend analysis • Common inputs for models : meteorology (IFS except for CMAQ and RCG), emissions (EC4MACS dataset), boundary conditions (MACC), domain (except CMAQ) • Iterativeprocess, withseveralimprovementsperformed by the modelling teams • One report written for the 2009 campaign and 5 publications ongoing for all campaigns
Teams & models RCG : different meteorology CMAQ : different meteorology and domain ENS=CAMX,CHIM, EMEP, LOTO, MINNI
Wind speed (U10) and Temperature (T2M) ~1 million data ~1 million data
Planetary Boundary Layer (PBL) • Various ways to calculate the PBL • Very different PBL over the oceans • Negative biases for all models except for CMAQ (compared to PBL at 12:00) • The most negative biases are observed for MINNI on average in Europe
Diurnal cycle at SIRTA (PBL, U10) – CAMX versus Obs • Results for the 2009 campaign • Positive bias particularly important early in the morning for the wind speed • Important negativebias for the PBL during the night • Shift of threehours for the collapse of the PBL
Ozone • Strong impact of boundary conditions • RMSE close to 20 µg m-3 • CMAQ gives the lowestcorrelations for all campaigns • Negativebiasatseveral medium altitude / shore sites • ENS (without RCG and CMAQ)
NO2 • Similarcorrelations (0.6-0.7) • CMAQ overestimates the concentrations • CAMX systematicallyunderestimate the concentrations • CMAQ & CHIMERE overshootat night, all modelsunderestimate in the afternoon
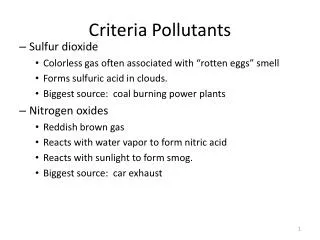
SO2 • The coefficient of variation is the lowest over emission areas but very high in remote areas like over the oceans • Very different way to simulate the SO2 chemistry and deposition processes in the models. • Diurnal cycle??!!
PM10 • In general, the modelsunderestimate, MINNI and EMEP have the lowestunderestimations (PBL effect?) • Flat diurnal cycle in the observations, slightdecrease in the afternoon for the models
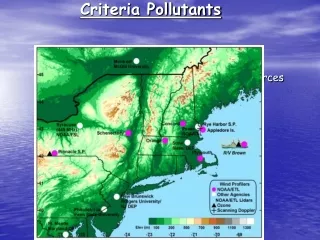
PM10 Left column: Average PM10 concentrations (µg m-3) of the “ensemble” (ENS) for the 2009 campaign with corresponding observations (coloured dots). Right column: coefficient of variation of models (no unit) constituting the ensemble with corresponding normalized root mean square errors of the “ensemble” (coloured dots).
PM2.5 • General underestimationsparticularly in winter • Correlationsbetween 0.5 and 0.7 • Flat profile with a slightincrease for the 2006 campaign in the observations – Modelssee a decrease in the afternoon
Nitrate & OM Coarse nitrate? Systematic underestimation Lack of emissions – SOA production Underestimation of higest values Robustness of SIA chemistry
Some conclusions • Important role of boundary conditions on O3 mean values • The ensemble gives a good picture of PM patterns in Europe with a systematic underestimation • Diurnal cycles show a large impact of the PBL diurnal evolution • Quality of meteorological data • Models underestimate the PBL, for some of them this undertimation could be very important during the night • Wind speed is overestimated on average (problem for low wind speed conditions) • There is a lack of chemical production in the afternoon for PM • The highest PM values are underestimated (role of dust and OM) – lack of sources (condensable organic species) • Some models can be better for one species but this can hide compensation effects on some PM components (next presentation)
Ensemble of CO – Coefficient of variation • Low coefficient of variation far from the sources • Vertical mixingiscertainly the mostinfluencial variable affecting the dilution/mixing of sources
PM2.5 Left column: Average PM2.5 concentrations (µg m-3) of the “ensemble” (ENS) for the 2009 campaign with corresponding observations (coloured dots). Right column: coefficient of variation of models (no unit) constituting the ensemble with corresponding normalized root mean square errors of the “ensemble” (coloured dots).