Download
1 / 49
490 likes | 502 Views
This report analyzes data on California's child welfare outcomes and accountability system, including referral rates, entry events by placement type, foster care caseload, and more. The report also discusses the purpose of Child and Family Services Reviews (CFSRs) and the statewide assessment process.

E N D
Data Are Your Friends:California’s Child Welfare Outcomes and Accountability System Barbara Needell, MSW, PhD Center for Social Services Research University of California at Berkeley The Performance Indicators Project is a collaboration of the California Department of Social Services and the University of California at Berkeley, and is supported by the California Department of Social Services and the Stuart Foundation
3 Key Data Samples Data
2002-2007California:Referrals, Substantiations & Entry Rates (per 1,000 Children) Referral Rates (-2.8%) Substantiation Rates (-10.6%) Entry Rates (-3.0%)
1998 to 2008California:Entry Events by Placement Type(entries lasting 8 or more days) 36,777 TOTAL Entries 30,884 Foster Kinship Group/Shelter FFA 1998 1999 2000 2001 2002 2003 2004 2005 2006 2007 2008
1998 to 2008California:Foster Care Caseload by Placement Type 104,325 Kinship TOTAL Caseload 70,423 Foster FFA Group/Shelter 1998 1999 2000 2001 2002 2003 2004 2005 2006 2007 2008
Tracking Child Welfare Outcomes Rate of Referrals/ Substantiated Referrals Home-Based Services vs. Out of Home Care Reentry to Care Permanency Through Reunification, Adoption, or Guardianship Counterbalanced Indicators of System Performance Use of Least Restrictive Form of Care Length of Stay Positive Attachments to Family, Friends, and Neighbors Stability of Care Source: Usher, C.L., Wildfire, J.B., Gogan, H.C. & Brown, E.L. (2002). Measuring Outcomes in Child Welfare. Chapel Hill: Jordan Institute for Families,
Outcomes, outcomes, everywhere Government Performance Results Act of 1993 (GPRA) Annual Outcomes Report to Congress mandated by Adoption and Safe Families Act (ASFA) of 1997 Statewide Data Indicators in Child and Family Services Reviews -- a subset of the Annual Outcomes—from National Child Abuse and Neglect Data System (NCANDS) and Adoption and Foster Care Analysis and Reporting System (AFCARS) Round 1 of CFSR FFY 2001-2004 (CA 2002) Round 2 of CFSR FFY 2007-2010 (CA 2008) California Child Welfare Outcomes and Accountability System (2004)
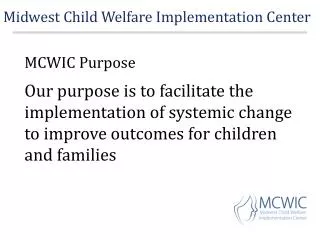
Purpose of CFSRs To assess State conformance with title IV-B and IV-E State plan requirements such that: The State is achieving desired outcomes for children and families in the areas of safety, permanency, and well-being (7 outcomes) The State system is functioning at a level that promotes achievement of the identified outcomes (7 systemic factors)
CFSR Review Process Statewide Assessment Onsite Review Determination of substantial conformity Program Improvement Plans
Changes to the CFSR • Round 1 of the CFSRs • 2 of the “outcomes” = 6 items (2 for safety, 4 for permanency) • National Standards attached: based on the 75th %tile of reporting states • States failing to meet a given standard had to include that item in their Performance Improvement Plans (PIPs) • Round 2 of the CFSRs • Also comprised of 6 items with standards attached • BUT…this time the permanency standards are comprised of 15 different measures distilled into four composites • TOTAL of 17 FEDERAL MEASURES
CA CWS Outcomes System California Child Welfare System Improvement and Accountability Act (AB636) became law in 2001 and went into effect in January 2004—quarterly outcomes reports at state and county level. Includes federal measures, has changed to reflect federal changes Provides additional measures needed to understand performance (e.g., % of siblings placed together). We are working on additional measures of well-being. Mirrors Family to Family Outcomes Retains key process measures (e.g., child visits, time to investigation) Began with county self assessments and System Improvement Plans (SIPS) that identified key challenges and strengths, updated periodically Peer Quality Case Reviews (PQCRs) are being conducted in each county to dig deeper into specific issues
CFSR: Seven Outcomes Safety Children are, first and foremost, protected from abuse and neglect. Children are safely maintained in their homes whenever possible and appropriate. Permanency Children have permanency and stability in their living arrangements. The continuity of family relationships and connections is preserved for children. Child and Family Well-Being Families have enhanced capacity to provide for their children's needs. Children receive appropriate services to meet their educational needs. Children receive adequate services to meet their physical and mental health needs.
CFSR: Seven Systemic Factors Statewide information system Case review system Quality assurance program Staff and provider training Service array Agency responsiveness to the community Foster and adoptive parent licensing, recruitment and retention
National Standards National standards for both the safety indicators and permanency composites are based on State performance in 2004, 75th percentile In California, we at CSSR attempt to replicate each of the measures and composite scores, break them out by child welfare and probation agencies, and report/update quarterly. Although national standards have been set for the composites rather than individual measures… The goal is to improve State performance on all measures (every improvement reflects a better outcome for children) Improvement on any given measure will result in an increase in the overall composite score We post the 75th percentile performance for each indicator/measure and call it the national goal
Indicator 1 Safety Indicator 2 Measure 1 Measure 2 Measure 3 Measure 4 Component A Component B Composite 1 Measure 1 Measure 2 Measure 3 Measure 4 Measure 5 Component A Component B Component C Composite 2 Permanency Measure 1 Measure 2 Measure 3 Component A Component B Composite 3 Composite 4 Measure 1 Measure 2 Measure 3
S1.1 Safety S2.1 C1.1 C1.2 C1.3 C1.4 Composite 1: Reunification C2.1 C2.2 C2.3 C2.4 C2.5 Composite 2: Adoption Permanency Composite 3: Long-Term C3.1 C3.2 C3.3 Composite 4: Stability C4.1 C4.2 C4.3
Measure Contributions to Composites Reentry Following Reunification (Exit Cohort) Reunification Within 12 Months (Entry Cohort) Median Time To Reunification (Exit Cohort) Reunification Within 12 Months (Exit Cohort)
Measure Contributions to Composites Adoption Within 12 Months (Legally Free) Legally Free Within 6 Months (17 Months In Care) Adoption Within 12 Months (17 Months In Care) Median Time To Adoption (Exit Cohort) Adoption Within 24 Months (Exit Cohort)
Measure Contributions to Composites In Care 3 Years Or Longer (Emancipated/Age 18) Exits to Permanency (Legally Free At Exit) Exits to Permanency (24 Months In Care)
Measure Contributions to Composites Placement Stability (At Least 24 Months In Care) Placement Stability (12 To 24 Months In Care) Placement Stability (8 Days To 12 Months In Care)
10% 12% Percent Change Time Period 1 Time Period 2 % %
January 2004-October 2008California CWS Outcomes System:AB636 Measures, % IMPROVEMENT (+) or (–) indicates direction of desired change Decline in Performance Improvement in Performance
January 2004-October 2008California CWS Outcomes System:Federal Measures, % IMPROVEMENT (+) or (–) indicates direction of desired change Decline in Performance Improvement in Performance
October 2008California CWS Outcomes System:Performance Relative to Federal Standard/Goal Federal Standard/Goal 100% 100%
2002 to 2008California: C4.1,2,3: Placement Stability Count 2002 2003 2004 2005 2006 2007 2008
2007California:Ethnicity and Path through the Child Welfare System (Missing Values & Other Race Excluded from % Calculations, <18 years of Age)
2007California:Ethnicity and Path through the Child Welfare System (Missing Values & Other Race Excluded from % Calculations, <18 years of Age)
2007California:Ethnicity and Path through the Child Welfare System (Missing Values & Other Race Excluded from % Calculations, <18 years of Age)
2007California:Ethnicity and Path through the Child Welfare System (Missing Values & Other Race Excluded from % Calculations, <18 years of Age)
2007California:Ethnicity and Path through the Child Welfare System (Missing Values & Other Race Excluded from % Calculations, <18 years of Age)
2007California:Ethnicity and Path through the Child Welfare System (Missing Values & Other Race Excluded from % Calculations, <18 years of Age)
2007California:Referrals per 1,000 by Age and Ethnicity *Series Total
2007California:Substantiated Referrals per 1,000 by Age and Ethnicity *Series Total
2007California:Entries to Foster Care per 1,000 by Age and Ethnicity *Series Total
2007California:Children in Foster Care per 1,000 by Age and Ethnicity *Series Total
2007California:Exits from Foster Care per 1,000 (In Care Population)by Age and Ethnicity *Series Total
2007California: Referrals, Substantiated Referrals, Entries, & In Care Rates per 1,000 by Age and Ethnicity Black Children White Children Hispanic Children Asian/PI Children
2007California:Racial Disparity Indices (group compared to White) Black Native American Hispanic Asian/PI Underrepresented 1.00 Overrepresented
1998 to 2007California:Children Entering Care by Race/Ethnicity 39,644 TOTAL Entries 36,011 Hispanic White Black Asian/PI Native American 1998 1999 2000 2001 2002 2003 2004 2005 2006 2007
1998 to 2008California:Foster Care Caseload by Race/Ethnicity 104,325 TOTAL Caseload Black Hispanic 70,423 White Asian/PI Native American 1998 1999 2000 2001 2002 2003 2004 2005 2006 2007 2008
2000 July-December First EntriesCalifornia: Percent Exited to Permanency 84 Months From Entry 87%
2000 July-December First Entries California: Percent Exited to Permanency 84 Months From Entry 81% 90%
2000 July-December First EntriesCalifornia: Percent Exited to Permanency 84 Months From Entry by Relative vs. Non-Relative Placement =87% =94% =77% =85%
Using the UCB/CDSS Website Quarterly reports, including dynamic compare feature New Composite Planner (coming soon!) Ability to examine breakouts (age, race, gender, etc.) and performance over time Additional reports above and beyond CA Child Welfare Outcomes System and CFSR (enhanced recurrence and entry cohort tables, entry cohort stability table)
Using the UCB/CDSS Website Child Welfare Course Curriculum? Student Research? Faculty Research? Field Work Preparation? IVE Placement Preparation?
Barbara Needell bneedell@berkeley.edu 510-290-6334 CSSR.BERKELEY.EDU/UCB_CHILDWELFARE Needell, B., Webster, D., Armijo, M., Lee, S., Dawson, W., Magruder, J., Exel, M., Glasser, T., Williams, D., Zimmerman, K., Simon, V., Putnam-Hornstein, E., Frerer, K., Cuccaro-Alamin, S., Winn, A., Lou, C., & Peng, C. (2008). Child Welfare Services Reports for California. Retrieved [month day, year], from University of California at Berkeley Center for Social Services Research website. URL: <http://cssr.berkeley.edu/ucb_childwelfare> Presentation Developed by Emily Putnam-Hornstein and Christine Wei-Mien Lou