Download
1 / 20
200 likes | 452 Views
Explore the concept of inequalities in algebra, learn how to solve linear and nonlinear inequalities, and understand the principles behind them. Examples and step-by-step solutions are provided to help you grasp the topic effectively.

E N D
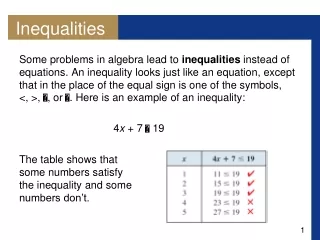
Inequalities • Some problems in algebra lead to inequalities instead of equations. An inequality looks just like an equation, except that in the place of the equal sign is one of the symbols, <, >, , or . Here is an example of an inequality: • 4x + 7 19 • The table shows that some numbers satisfy the inequality and some numbers don’t.
Inequalities • To solve an inequality that contains a variable means to find all values of the variable that make the inequality true. An inequality generally has infinitely many solutions, which form an interval or a union of intervals on the real line. • The illustration shows how an inequality differs from its corresponding equation:
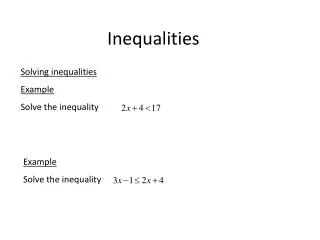
Example 1 – Solving a Linear Inequality • Solve the inequality 3x < 9x + 4 and sketch the solution set. • Solution: • 3x < 9x + 4 • 3x – 9x < 9x + 4 – 9x • –6x < 4 • ( )(–6x) > ( )(4) • x > • Given inequality • Subtract 9x • Simplify • Multiply by and reverse inequality • Simplify
Example 1 – Solution • cont’d • The solution set consists of all numbers greater than • In other words the solution of the inequality is the interval ( , ). It is graphed in Figure 1. • Figure 1
Solving Nonlinear Inequalities • To solve inequalities involving squares and other powers of the variable, we use factoring, together with the following principle.
Inequalities • Pay special attention to Rule 4 : if we multiply each side of an inequality by a negative number, then we reverse the direction of the inequality. • For example, if we start with the inequality 3 < 5 • And multiply by –2, we get –6 > –10 • An inequality is linear if each term is constant or a multiple of a 1st degree variable.To solve a linear inequality, we isolate the variable on one side of the inequality sign.
Solving Nonlinear Inequalities • Warning: The factoring technique that is described in these guidelines works only if all nonzero terms appear on one side of the inequality symbol.
Example 3 – Solving a Quadratic Inequality • Solve the inequality x2 5x – 6. • Solution:We will follow the guidelines given above. • Move all terms to one side.We move all the terms to the left-hand side. • x2 5x – 6 • x2 – 5x +6 0 • Given inequality • Subtract 5x, add 6
Example 3 – Solution • cont’d • Factor.Factoring the left-hand side of the inequality, we get • (x – 2)(x – 3) 0 • Find the intervals.The factors of the left-hand side are x – 2 and x – 3. These factors are zero when x is 2 and 3, respectively. • If you place these “critical points” on the number line you divide the number line into three regions • Factor
Example 3 – Solution • cont’d • As shown in Figure 3, the numbers 2 and 3 divide the real line into the three intervals • (– , 2), (2, 3), (3, ) • The factors x – 2 and x – 3 change sign only at 2 and 3, respectively. So these factors maintain their sign on each of these three intervals. • Figure 3
Make a table or diagram • cont’d • To determine the sign of each factor on each of the intervals that we found, we use test values. We choose a number inside each interval and check the sign of the factors x – 2 and x – 3 at the number we chose. • For the interval (– , 2), let’s choose the test value 1 • Figure 4
Example 3 – Solution • cont’d • . Notice that we need to check only one test value for each interval because the factors x – 2 and x – 3 do not change sign on any of the three intervals we found.
Using the test values x = 0 , x = 2½, and x = 4 for the intervals (- ∞,2), (2, 3) and (3, ∞ ) we construct the following sign table • The final row of the table is obtained from the fact that the expression in the last row is the product of the two factors ∞
Example 3 – Solution • cont’d • If you prefer, you can represent this information on a real line, as in the following sign diagram. • The vertical lines indicate the points at which the real line is divided into intervals: • test pts x=1, 2.5, and 4
Example 3 – Solution • cont’d • Solve.We read from the table or the diagram that (x – 2)(x – 3) is negative on the interval (2, 3). Thus, the solution of the inequality (x – 2)(x – 3) 0 is • {x | 2 x 3} = [2, 3] • We have included the endpoints 2 and 3 because the product is either less than or equal to zero. The solution is illustrated in Figure 5. • Figure 5
Absolute Value Inequalities • We use the following properties to solve inequalities that involve absolute value.
Example 6 – Solution 2 • Geometrically, the solution set consists of all numbers x whose distance from 5 is less than 2. • From Figure 9 we see that this is the interval (3, 7). • Figure 9
Example 6 – Solving an Absolute Value Inequality • Solve the inequality |x – 5| < 2. • Solution 1: The inequality |x – 5| < 2 is equivalent to • –2 < x – 5 < 2 • 3 < x < 7 • The solution set is the open interval (3, 7). • Property 1 • Add 5