Waste Processing Assumptions
10 likes | 145 Views
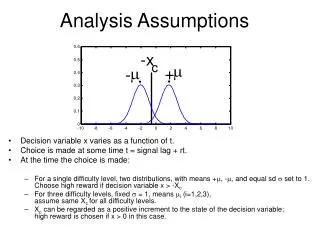
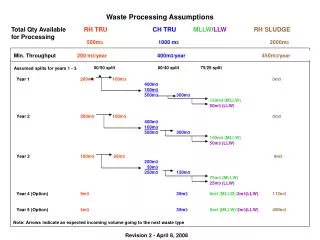
Waste Processing Assumptions. Total Qty Available RH TRU CH TRU MLLW / LLW RH SLUDGE for Processing. 500m 3 1000 m 3 2000m 3. Min. Throughput 200 m 3 /year 400m 3/ year 450m 3 /year. 50/50 split. 60/40 split. 75/25 split. Assumed splits for years 1 - 3.

Waste Processing Assumptions
E N D
Presentation Transcript
Waste Processing Assumptions Total Qty Available RH TRUCH TRUMLLW/LLWRH SLUDGE for Processing 500m31000 m32000m3 Min. Throughput 200m3/year400m3/year450m3/year 50/50 split 60/40 split 75/25 split Assumed splits for years 1 - 3 Year 1200m3100m30m3 400m3 100m3 500m3300m3 150m3 (MLLW) 50m3 (LLW) Year 2200m3100m30m3 400m3 100m3 500m3300m3 150m3 (MLLW) 50m3 (LLW) Year 3 100m350m30m3 200m3 50m3 250m3150m3 75m3 (MLLW) 25m3 (LLW) Year 4 (Option)5m335m38m3 (MLLW)/2m3(LLW)112m3 Year 5 (Option)5m335m38m3 (MLLW)/2m3(LLW)450m3 Note: Arrows indicate an expected incoming volume going to the next waste type Revision 2 - April 8, 2008