Download
1 / 31
310 likes | 887 Views
The Test for Significant Toxicity (TST) – A “New” Hypothesis Testing Approach for Aquatic Bioassay Testing. Philip Markle Environmental Scientist pmarkle@lacsd.org. History of the TST. June 2010 – EPA released WET TST guidance (EPA 833-R-10-003) Also referred as: Bioequivalence Testing

E N D
The Test for Significant Toxicity (TST) – A “New” Hypothesis Testing Approach for Aquatic Bioassay Testing Philip Markle Environmental Scientist pmarkle@lacsd.org
History of the TST • June 2010 – EPA released WET TST guidance (EPA 833-R-10-003) • Also referred as: • Bioequivalence Testing • Alternative Null Hypothesis Testing • Accepted for FDA drug trials and evaluations • Originally proposed for use in toxicity testing in 1995 (Erickson and McDonald) • Recently proposed for CA’s WET Policy
Limitations of the TST • It is still a statistical hypothesis test • Not very useful for comparing results spatially or temporally • Pass/Fail test, provides no information on magnitude • Requires knowledge/use of a “threshold” response – “b” or bioequivalence factor • Probably (and debatably) best suited for regulatory purposes
Statistical Hypothesis Testing 101 • Statistical speaking; • You can’t “prove” anything with a hypothesis test – we only “disprove” • The “White Swan” Parable:
Statistical Hypothesis Testing 101 • You can’t prove that “all swans are white” • If we see 10,000 white swans and no non-white swans, we fail reject our hypothesis • In the absence of evidence to the contrary, we then assume the hypothesis is true
“Proving” with Statistics • However, after observing just one non-white swan, we can then confidently reject or disprove our hypothesis that all swans are white
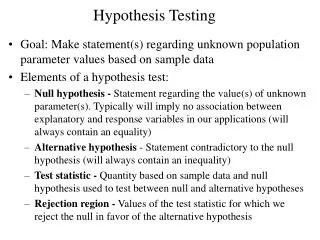
Statistical Hypothesis Testing - Background • Null or “Initial” Hypothesis (Ho) • Mean(sample) Mean(control) • Conduct statistical analyses to try to reject this hypothesis • If unable to reject, we assume the null or “Initial” hypothesis is correct • Type I and Type II error
Type I and Type II Errors • Type I Error • Probability of rejecting when the null or “Initial” hypothesis when it is “true” • Controlled directly by setting alpha () • Type II Error • Probability of accepting the null or “Initial” hypothesis when it is “false” • Also called “power” () • Controlled indirectly
Standard Hypothesis Testing (NOEC) • With the NOEC: • The initial hypothesis is mean (sample) mean (control) In other words, the sample is non-toxic! • If we don’t/can’t “prove” this to be incorrect statistically, we assume it is true • Type I error = Identifying a non-toxic sample as toxic
TST Hypothesis • With the TST: • The hypothesis is mean(effluent) =/< 0.75 * mean(control) In other words, the sample is toxic! • If we don’t/can’t “prove” this to be incorrect statistically, we assume it is true – we assume the sample is toxic • Type I error = Identifying a toxic sample as non-toxic
Bioequivalence Factor (b) • In the EPA Guidance • Set as an unacceptable or “toxic” threshold • For Chronic: • B = 0.75 = 25% Effect • For Acute • B = 0.80 = 20% Effect
Regulatory Management Decisions (RMDs) • Setting the Type I Error Rate–alpha () • How frequent will you reject the Ho when it is true? • EPA desires that no more than 25% of the tests with a 25% effect or more are identified as “non-toxic” • Alpha () is then set at 0.05 to 0.25, depending on the test
Why the Different Alphas? • EPA’s Second Regulatory Management Decision • No more than 5% of tests with effects less than 10% should be identified as toxic • Type II Error Rate – not really a “false positive” • Alpha adjusted down until no more than 5% of tests with effects less than 10% were identified as “toxic” • Monte Carlo simulations
TST Equation (Welch’s t-test) • t = • t (calculated) < t (table/critical) = toxic • t (calculated) > t (table/critical) = non-toxic
Factors That Impact Ability to Statistically Reject the Hypothesis • Magnitude of Effect • Number of Replicates • Within Test Variability
TST Equation (Welch’s t-test) • t = • All tests (100%) with an effect of 25% will be identified as “toxic” • The greater the within test variability, the harder or less likely it will be to identify a sample as being statistically different (non-toxic). • The more replication, the more likely it will be to identify a sample as being statistically different (non-toxic).
Controllable Factors That Impact Ability to Statistically Reject the Hypothesis • Variability • The greater the within test variability, the harder or less likely it will be to identify a sample as being statistically different. • For the “regular” hypothesis test • Less frequent identification of “toxicity” • For the TST • Less frequent identification of “no toxicity” • Replication
Procedures That May Reduce Variability • Maximize Mean Response • CV = S.D. / Mean From EPA Test of Significant Toxicity (TST) Document EPA 833-R-10-003
Impact of Control Mean • At the 10th Percentile (17.7) - a 25% effect is reduction of 4.4 neonates • At the 50th Percentile (25.5) - a 25% effect is reduction of 6.4 neonates • At the 95th Percentile (35.6) - a 25% effect is reduction of 8.9 neonates
Procedures That May Increase Mean Response • Dilution Water Selection • Match sample condition as much as possible • Food Supplements, Combinations • Specifically allowed (13.6.16.9.2) • Feeding Rates • Twice or three times per day • Amount of food
Procedures That May Decrease Variability • Set Internal Control CV Criteria
Procedures That May Decrease Variability • Set Internal Control Mean Criteria
Statistical andNon-statistical Error • False Determinations of Toxicity
Dose Response Evaluation • Eliminating multiple concentrations may limit ability to evaluate spurious results.
Conclusions • Same limitations as any hypothesis test • Implications associated with variability and “power” shifted • Not a magical “black box” • You need to be aware of the impact variability, QA/QC, and test design may have • May be useful for regulation • NPDES Permits • Possible use for remediation goals?
Questions? Contact info: pmarkle@lacsd.org