Radioactivity measurements using embedded processing
Radioactivity measurements using embedded processing. Aran Mol, INCAS 3. What is INCAS³?. A private research institute Driven by industry and social demands Full development cycle from needs analyses to product Strong international academic and industrial network. Example projects.

Radioactivity measurements using embedded processing
E N D
Presentation Transcript
Radioactivity measurements using embedded processing Aran Mol, INCAS3 TIPP2014 Amsterdam
What is INCAS³? • A private research institute • Driven by industry and social demands • Full development cycle from needs analyses to product • Strong international academic and industrial network TIPP2014 Amsterdam
Exampleprojects AgroBot Other examples: SPRINT – Balance training for elderly people MoreWise– Mapping underground oil reservoirs Panic detection – Automatic classification of sound events ENSA/DROPS – Monitoring (natural) radioactivity RoboShip SinBot TIPP2014 Amsterdam
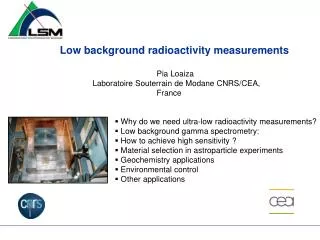
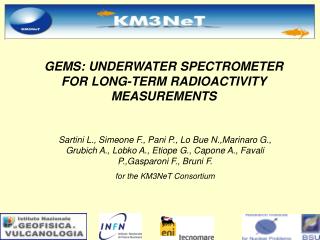
Radiation detection • Focus on low levels of (natural) radioactivity • Manyapplications • Geophysics • Oil & Gas • Medical • Environmental • Security • … TIPP2014 Amsterdam
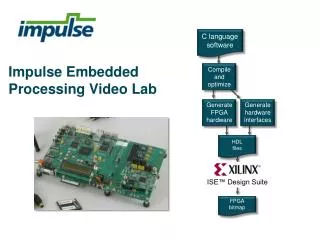
Challenge = to “sensorize” • Move “acquisition chain” to embedded solution • In our case: • Embed detector drift feedback algorithms • Embed spectral processing algorithms • Embed data storage • Embed data visualization TIPP2014 Amsterdam
System philosophy • Early digitization • Local processing, self diagnostics, calibration Embeddedprocessing Environment Transducer ADC Information Control TIPP2014 Amsterdam
Detector system • Complex sensor • Modular approach FPGA ADC NaI spectra 24Gb/s activity concentrations 500MHz ±1.0 V +V -V TIPP2014 Amsterdam
System overview • Modules in stack • 3 main boards • Fast ADC board • FPGA board • ARM board • 1 for additional functionality • Additional DACs & ADCs • Connectivity • GPS TIPP2014 Amsterdam
ADC board Analog signal Register settings Digital data • Signal conditioning • Single-ended • Balanced • Amplification • Digitization • 2 GHz; 12 bit; single channel ADC +V -V TIPP2014 Amsterdam
FPGA board Spectra or raw data Register readout ADC settings Clock signals Power ADC data parameters • Event detection • Event descriptor extraction • Energy • Time of detection • ... • Performance parameters • Signalstability • Baseline tracking • Noise tracking • Pile-up rejection FPGA TIPP2014 Amsterdam
FPGA board - signal analysis FIR - MWD FIR - MA histogram • Parameters set at runtime by user • Dead time: 1.14 µs (maximum) signal baseline amplitude MWD MA Amplitude (a.u.) Time (a.u.) TIPP2014 Amsterdam
ARM board Activities Analyzed spectra Raw data Parameters Measuredspectra & raw data HV readout Register readout User settings • Ethernet connection • Temperature stabilization of spectrum • Full spectrum analysis • C++ code on Linux buildroot • Interface server TIPP2014 Amsterdam
ARM board - FSA • Calibrated reference spectra for U, K, Th, (+ Rn) • Weights to equalize the errors • Yields activity concentrations and accuracy of estimation TIPP2014 Amsterdam
Full-Spectrum-Analysis Weight factors Activity Uncertainty TIPP2014 Amsterdam
Calibration procedure • Volume source: semi-infinite brick castle • MCNPX simulations used to determine detector response • With detector response known, standard spectra can be calculated for any isotope and geometry TIPP2014 Amsterdam
Precision • Energy resolution of detector: 7.0 % at 662 keV • Very accurate activity estimations • Very small nonlinear term TIPP2014 Amsterdam
Interface • Web server • Easily accessible • Easily changed • Tabs: • Live view • Settings • Data storage • System lineage TIPP2014 Amsterdam
DROPS project • Dynamic Rain Observation & ParametrizationSystem • High-school collaboration project • Study correlation between weather and radon activity 222Rn 222Rn 222Rn TIPP2014 Amsterdam
DROPS results • Continuous dataset from 22 July to 22 October TIPP2014 Amsterdam
Ongoing work... • Continueddevelopment of detector electronics & scintillatorsignal processing • Testing & certification • Field testing Canada • Temperatureandmechanicalstabilitytesting • Advanced real time analysis & control • Pile up correction • Pulseshapediscrimination • Neutron detection • Improve fitting procedure TIPP2014 Amsterdam
Applications • Environmental monitoring • Pilot: Uranium mining Canada • Precision farming • Soil content in sugar beet harvesting • Nuclear reactor monitoring • First tests expected this year TIPP2014 Amsterdam
Thank you INCAS3 is sponsored by: TIPP2014 Amsterdam