Download
1 / 57
580 likes | 671 Views
Using Scientific Measurements. The conditions under which a meas-urement is obtained has a tremend-ous impact on the ______________ of the measurement. Some balances, rulers, graduated cylinders, and other measuring devices can be more ________ __________ read than others. Pg 44-57.

E N D
Using Scientific Measurements • The conditions under which a meas-urement is obtained has a tremend-ous impact on the ______________ of the measurement. • Some balances, rulers, graduated cylinders, and other measuring devices can be more ________ __________ read than others. Pg 44-57 Sec 2-3
Which of the measuring devices would provide a more accurate measurement? Pg 44-57 Sec 2-3
Using Scientific Measurements • Using a ________________ of mea-sure you can be certain of the accu-racy of some of the digits measured • the last digit of the measurement is however, questionable • Leaving that last digit out would be misleading • you do have some indication of the ___________________ Pg 44-57 Sec 2-3
Using Scientific Measurements • Therefore you would estimate the value to the ___________________. • In science, measured values are reported in terms of digits that are certain + _____________________. • The last digit is always estimated, but it is not always significant Pg 44-57 Sec 2-3
Pg 44-57 Sec 2-3
Using Scientific Measurements • Determining a digit or number to be significant does not mean it is certain. • It is a _____________________ • We need to be able to recognize when a digit is significant or insignificant Pg 44-57 Sec 2-3
Using Scientific Measurements Sig fig rule #1 • each nonzero digit is significant • Digits ___________ • In the number 37.6 how many of the digits are significant according to this rule? 37.6 ___________ Pg 44-57 Sec 2-3
_________ Using Scientific Measurements Sig fig rule #2 • Any Zero digit sandwiched between to significant figures are themselves significant • in the number 370.6 how many significant figures are there? 370.6 Pg 44-57 Sec 2-3
Using Scientific Measurements Sig fig rule #3 • Follow/follow rule • A zero that follows the decimal and follows the number is significant 279.0, 27.90, 2.790, & .2970 _______ How many sig figs? Pg 44-57 Sec 2-3
Using Scientific Measurements Sig fig rules • All nonzero digits rule • Sandwich rule • Follow/follow rule Pg 44-57 Sec 2-3
Using Scientific Measurements Alternative indicators: • A dashed line over a zero indicates its significance: • A decimal after a non-decimal number indicates that all digits are significant: Pg 44-57 Sec 2-3
Using Scientific Measurements • Just because the calculated answer in your calculator has ___________ in the answer – doesn’t mean they are all significant • The measurement with the smallest significant digits determines the number of sig figs in the final answer. Pg 44-57 Sec 2-3
Using Scientific Measurements • Answers calculated from measure-ments ________________________ _________________________ than any of the original measurements • Answers must be rounded off to the same number of sig figs as the measurement with the smallest number of sig figs. Pg 44-57 Sec 2-3
Addition/Subtraction Rule: With Addition and Subtraction keep only the number of decimals in the result that occur in the least precise number. 101.25 numbers to be _______ + 3536.2 + 123.448 SIG FIGS IN CALCULATIONS = 3760.898 contains the _____ amount of precision last digit ___ Pg 44-57 Sec 2-3
contains the ______ amount of precision last digit ____ numbers to be _______ Multiplication/Division Rule: With Multiplication and Division, the final result should only have as many significant figures as the term with the least number of significant figures. 101.25 x 3536.2 SIG FIGS IN CALCULATIONS 2900.333 = 123.448 Pg 44-57 Sec 2-3
400.338 = 400.34 400.333 = 400.33 400.3351 = 400.34 400.3350 = 400.34 400.3250 = 400.32 Pg 44-57 Sec 2-3
Using Scientific Measurements • In chemistry we will work with very large and very small numbers. and • Can you imagine using these numbers several times in one set of problems! Pg 44-57 Sec 2-3
Using Scientific Measurements • Fortunately scientists have come up with a way to get around this problem • _______________________ • Any number in scientific notation can be separated into two segments • A ______________ between 1 and 9 • An ______________________ Pg 44-57 Sec 2-3
Same measurement in scientific notation: ___ x 10__ # BETWEEN 1 AND 9 EXPONENTIAL POWER OF 10 Using Scientific Measurements Anatomy of a number in scientific notation The measurement:410,000,000 miles Pg 44-57 Sec 2-3
Using Scientific Measurements • For a number greater than 1. Move the decimal point to the left until you reach a coefficient between 1 and 9 and place the decimal point there. Then count the places and write it as an exponent. 576,506,000,000,000,000 = _______________ Pg 44-57 Sec 2-3
Using Scientific Measurements • Given a small number just move the decimal point to the right until you reach the first digit between 1 and 9, and put the decimal there. Then count the places and write it as a negative exponent. 0.000,000,000,000,000,2697 = ______________ Pg 44-57 Sec 2-3
Using Scientific Measurements • The measurement written in scientific notation is the same number as the original large or small number • The exponent indicates how many times the number must be multiplied or divided by 10 to equal the original notation 3.14 x 10⁴ is equal to 3.14 x 10 x 10 x 10 x 10 = _____ Pg 44-57 Sec 2-3
Using Scientific Measurements • Write the following numbers in scientific notation 1) 32,700 __________ 2) 1,024,000 __________ __________ 3) 0.004 7100 Pg 44-57 Sec 2-3
The exponent entry key is usually labeled or EE EXP Using Scientific Measurements • Scientific Notation on a Calculator • When entering scientific notation on a calculator, enter only the first factor and the exponent of the power of 10 • This key automatically includes the 10. Pg 44-57 Sec 2-3
Using Scientific Measurements • Most scientific calcs will display the result in scientific notation when there are too many digits for the display • Be careful because the calc won’t determine the number of sig figs Pg 44-57 Sec 2-3
Press • Press 2 2 . . 5 5 0 1 • Press or , then press (this is the exponent 105) • Press or , then press (this is the exponent 104) EE EE EXP EXP 5 4 • Press X 6.25709 • Press , and displayed = • Calculate (2.50 x 10⁴) (2.51 x 10⁵) • This is equivalent to 6.257x10⁹ Pg 44-57 Sec 2-3
.71 * 100% 71% = = Using Scientific Measurements • In chemistry many of our results will be expressed as a percent. • A piece of a 100 • For instance, the questions answered correctly on a quiz can be written as a percent: _________ 35 possible Pg 44-57 Sec 2-3
Using Scientific Measurements • To determine the accuracy of a measurement we calculate what’s called the percent error • Percent error: when a measurement is compared to its accepted value |________________| X 100% accepted Pg 44-57 Sec 2-3
|_________________| X 100% % error = accepted Using Scientific Measurements • Let’s assume in a lab we were expecting to make 5.00g of product; instead we made 4.50g, what is our percent error? |____g – 5.00g| X 100% 5.00g Pg 44-57 Sec 2-3
Using Scientific Measurements • Setting up a mathematical equation and solving for an unknown is not the only method scientists have for analyzing data. • Sometimes it’s useful to __________ _____ in the results of an experiment • It may not be useful to look that pattern from raw data in a table Pg 44-57 Sec 2-3
Using Scientific Measurements • Patterns in data are most obvious when a graph is created • A graph is a ___________________ ________________ • There are several types of graphing techniques and each has benefits • Circle • _____ • Line Pg 44-57 Sec 2-3
Using Scientific Measurements • Circle graphs (AKA __________): • A circle graph is typically divided into wedges like a pie or pizza • Useful for showing _____________ __________ • Divisions are usually labeled as percents with the circle as a whole representing 100% Pg 44-57 Sec 2-3
Using Scientific Measurements • Bar graph: • A bar graph often is used to show ___________________ with factors such as time, location, or temp • The relative heights of the bars show how the quantityvaries. Pg 44-57 Sec 2-3
Using Scientific Measurements • Most graphs that you create and interpret will be _________ in this class • The points on a line graph represent the intersection of data for 2 variables • The ___________ • The ___________ Pg 44-57 Sec 2-3
Using Scientific Measurements • The independent variable is the variable that a scientist deliberately changes during the experiment. • Remember it answers the question “What do we want to change?” • The independent variable is plotted on the ____________. Pg 44-57 Sec 2-3
Using Scientific Measurements • The dependent variable is the variable that responds to the changes in the independent variable • Remember it answers the question “What happened?” • The dependent variable is plotted on the _____________. Pg 44-57 Sec 2-3
Using Scientific Measurements • There are 4 basic steps to constructing a graph from data in the chemistry lab • ___________________ • Scaling the axes, • ___________________ • Titling your graph Pg 44-57 Sec 2-3
Using Scientific Measurements • Decide which variable is under control and can be varied. • That is your independent variable and is plotted on the x-axis • The x-axis is the ____________ • The y-axis is the dependent variable and the ___________. Pg 44-57 Sec 2-3
Using Scientific Measurements • The scale of the axes should include all data points AND to allow as much room as possible on both axes. • Each axis is evenly divided with plenty of space between divisions • Divisions in multiples _____________ • Axis should be labeled with what it ____________________ Pg 44-57 Sec 2-3
Using Scientific Measurements • If the plotted data points roughly form a ___________, use a ruler to draw a line that best represents the data • Called a _____________ • If the points do not form a straight line but appear to form a curve, lightly sketch a curve with a pencil, connecting all the data points. Pg 44-57 Sec 2-3
Using Scientific Measurements • It is important to add a title to the top of your graph, so that anyone looking at the graph ___________________ ____________. • Choose a title that is brief and descriptive of the data • Usually dependent variable vs. independent variable Pg 44-57 Sec 2-3
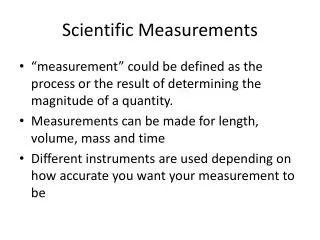
# of tickets sold Amount of money collected 5 $15 15 $45 25 $75 40 $120 45 $135 Using Scientific Measurements • Let’s construct a graph with this data that shows how much money will be made from selling certain numbers of tickets that are $3.00 apiece. Pg 44-57 Sec 2-3
# of tickets sold # of tickets sold Amount of money collected Amount of money collected 5 5 $15 $15 15 15 $45 $45 25 25 $75 $75 40 40 $120 $120 45 45 $135 $135 Using Scientific Measurements • Determine the independent variable • The amount of money collected depends on the # of tickets sold, therefore, it’s the independ- ent variable. • Graphed on the X-axis Pg 44-57 Sec 2-3
# of tickets sold Amount of money collected 5 $15 15 $45 25 $75 40 $120 45 $135 Using Scientific Measurements • The other variables is obviously the dependent • The dependent variable (amount of money collect- ed) is graphed on the y-axis Pg 44-57 Sec 2-3
Using Scientific Measurements • When ___________________ for the axes, consider what you want the graph to show and how it will be used. • You want to be able to easily deter-mine the amount of money made from selling different numbers of tickets Pg 44-57 Sec 2-3
Using Scientific Measurements • Choose a scale that is large enough that you can easily find values between your data points. • Decide ____________________ are needed on the x-axis • to easily determine the amount of money made for any # of tickets sold, choose a large # of divisions, such as ____ Pg 44-57 Sec 2-3
Using Scientific Measurements • Divide the largest value from the data table for the independent variable by the number of divisions chosen 45 4.5 = 10 • Find the closest whole number value that is a multiple of 1,2,5, or 10. • the divisions on our x-axis will be labeled in intervals of ___ Pg 44-57 Sec 2-3
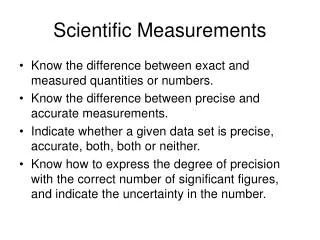
Using Scientific Measurements • Now determine the scale for the dependent variable. • Good choices would be 5 div. of $25 each or 10 div. of $15 • Plot the data one point at a time moving over the x and up the y, and mark the location with a clear dot • Draw the line that best fits the data. Pg 44-57 Sec 2-3
150 125 100 75 Revenue ($) 50 25 0 0 15 20 25 30 35 40 5 10 Number of tickets sold • • • • • Pg 44-57 Sec 2-3
150 125 100 75 Revenue ($) 50 25 0 0 15 20 25 30 35 40 5 10 Number of tickets sold • • • • • Pg 44-57 Sec 2-3