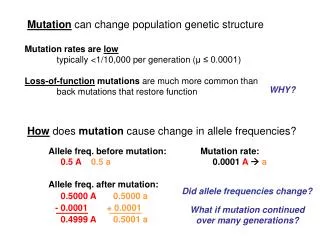
Why study population genetic structure?
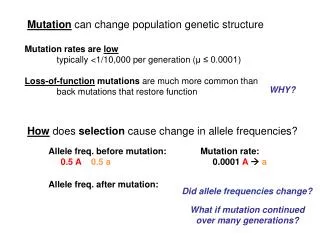
Why study population genetic structure?. In general, provides perspective on adaptation and speciation. Can reveal the recent demographic history of a population and the role of: Gene flow Genetic drift Inbreeding Natural selection Population size


Why study population genetic structure?
E N D
Presentation Transcript
Why study population genetic structure? In general, provides perspective on adaptation and speciation. Can reveal the recent demographic history of a population and the role of: Gene flow Genetic drift Inbreeding Natural selection Population size Can reveal the history of population structuring over deeper time. e.g. Phylogeography
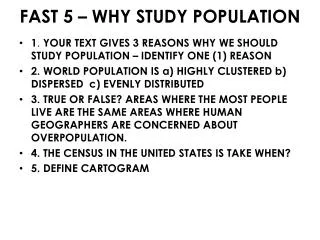
Why do we expect population genetic structures to vary within and among organisms? 1) Differences in mobility/dispersal ability 2) Differences in reproductive attributes/system 3) Differences in life history attributes 4) Differences in behavioral attributes Differences in geographic distribution Habitat patchiness or variability Historical reasons e.g. See Table 6.3 and 6.4
One of the first idealized models of a population From J. Hey, 2003, Nature Reviews Genetics, 4:535-544.
Models of population structure that allow for migration (Gene Flow) Idealized Population Models a. Island model b. Stepping stone c. Isolation by distance d. Metapopulation
Statistical Description of Population Structure Wright’s F statistics. A method to summarize how genetic variation is partitioned among different hierarchical levels. Among population level: FST = Vp / p (1 - p) This is a measure of the observed variation in allele frequencies among populations (regardless of how the variation arose).
Another way from Avise: FST = (ht - hs) / ht hs = mean expected heterozygosity at a locus within subpops under H/W ht = overall expected heterozygosity in total population (given allele freq & H/W) FST : Ranges from 1.0 to 0.0 subpopulations fixed for alternate alleles subpopulations have same alleles frequencies “structured” “not structured”
From Selander (1970): An analysis of mouse population structure within and among barns in Texas. Estimated Number of Mean Allele Variance of Population Size Pops Sampled Frequency Allele Frequency Es-3b Hbb Es-3b Hbb Small ~10 29 0.418 0.849 0.0506 0.1883 Large ~200 13 0.372 0.843 0.0125 0.0083 FST = Vp / p (1 - p) FST = 0.0506/(0.418)(0.582) = 0.208 for small pops FST = 0.0125/(0.372)(0.628) = 0.054 for large pops
Consider the joint effects of genetic drift and gene flow on population structure In the absence of migration, finite populations become more inbred and diverge from one another at random (with respect to allele frequencies) as a result of drift. The probability of autozygosity (that an individual carries IBD alleles at a locus) increases faster, the smaller the population. FST provides a measure of divergence under drift. At some point in time, as a population approaches FST = 1, the increase in autozygosity will be balanced by the rate of migration (and/or mutation also, in reality). An equilibrium is struck.
Migration rates (Gene Flow) can be estimated assuming an equilibrium FST has been reached: For neutral alleles in an island model, the equilibrium value of FST : ~ FST = 1 / 1 + 4Nm or, ~ Nm = (1 - FST ) / 4FST This is interpreted as the absolute number of individuals exchanged between populations. FST As Nm increases, decreases.
Gene Flow is a powerful thing FST = 0.20. If Nm = 1, Subpopulations are 20% more structured (inbred) than if all subpopulations essentially comprised a single, randomly mating population
However, FST is not very precise Measure. At best it can only provide qualitative perspective. 1.0 0.8 06. 0.4 0.2 0.0 FST Nm
More recently, there has been the development of DNA sequence variation approaches to the characterization of population structure. However, all summary statistic approaches live and die by the assumed demographic model. The model specifies meaning to the parameters and the assumptions that underlie them. A summary statistic doesn’t necessarily provide insight.