Download
1 / 22
220 likes | 326 Views
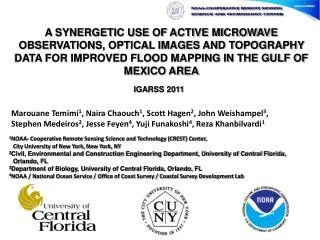
A SYNERGETIC USE OF ACTIVE MICROWAVE OBSERVATIONS, OPTICAL IMAGES AND TOPOGRAPHY DATA FOR IMPROVED FLOOD MAPPING IN THE GULF OF MEXICO AREA. IGARSS 2011.

E N D
A SYNERGETIC USE OF ACTIVE MICROWAVE OBSERVATIONS, OPTICAL IMAGES AND TOPOGRAPHY DATA FOR IMPROVED FLOOD MAPPING IN THE GULF OF MEXICO AREA IGARSS 2011 Marouane Temimi1, Naira Chaouch1, Scott Hagen2, John Weishampel3, Stephen Medeiros2, Jesse Feyen4, Yuji Funakoshi4, Reza Khanbilvardi1 1NOAA- Cooperative Remote Sensing Science and Technology (CREST) Center,City University of New York, New York, NY 2Civil, Environmental and Construction Engineering Department, University of Central Florida, Orlando, FL 3Department of Biology, University of Central Florida, Orlando, FL 4NOAA / National Ocean Service / Office of Coast Survey / Coastal Survey Development Lab
Integrated Models Dynamic Results Earth Data Tides Wave Tidal Inundation Moving Towards Spatial Storm Surge Model Validation Sediment Field/Lab Experiments Bay Salinity Global Climate Change Scenarios Coastal Erosion Shorelines Biological Biotic Overland Management Tools Coastal Dynamic Assessments Marsh, Oyster & SAV Assessments Societal and Coastal Ecosystem Benefits Management Actions
Northeastern Gulf of Mexico Study Area Apalachee Bay Shell Point Turkey Point Apalachicola River St. Andrew Bay Cedar Key Panama City Beach Shark River National Ocean Service Tidal Gaging Stations
Comparison of Simulated and Measured Tidal Signals (a) Apalachicola (c) Shell Point (d) Apalachee Bay (b) Turkey Point
Project Sub-Objective To demonstrate the efficacy of employing high resolution imagery to improve coastal inundation models that are presently employed by NOAA (NWS and NOS), USACE, and FEMA, and those soon to be applied operationally. Imagery will enable the assessment of wetting/drying algorithms and general spatial validation.
Radar is sensitive to water, due to its high dielectric constant, and hence valuable in characterizing wetlands • It differentiates between moist soil and standing water • Standing water interacts with the radar differently depending on vegetation structure • When exposed to open water without (or submerged) vegetation, specular reflection occurs. Double – bounce backscattering Specular scattering
Apalachicola Radarsat Scene Radarsat-1 03/03/2004 – low tide conditions
CO-register and re-sample to the same projection and pixel size Landsat 7 image (low tide) Radarsat 1 data LiDAR-derived DEM Speckle filtering Low contour line High contour line RGB colorcompositing Flood-prone areasmask Change detection within flood-prone areas Flooded / non-flooded areas map Validation with aerial photography
Radarsat Imagery *Acquisition time for all the Apalachicola scenes was 11h:40 GMT Historic Observed Water Level (Apalachicola, FL) (from NOAA Tides & Currents)
Radarsat Apalachicola Scene Dates andCorresponding Water Level MHHW -0.459 Low-water levelLandsat 7 scene (2/2/03; 15:56)
Radarsat Scene Color Composites 3/3/04 as low tide conditionRed = change to flooded backscatter ↓ Cyan = change from flooded backscatter ↑White = unchanged pixels
Intertidal Zone Composites 3/3/04 as low tide conditionRed = change to flooded backscatter ↓ Cyan = change from flooded backscatter ↑White = unchanged pixels
RGB image within the potential flooded area Flooded areas (red color)
Estimated Flooded Areas along St. James Peninsula 1/20/2003 9/17/2003 7/25/2004
07/25/04 01/20/03 09/17/03 Number of Flooded Pixels 03/03/04 Water Level (m)
Comparison with Historic Aerial Photographs Franklin County - FLDOT Site 101/04/1012:12 Green – detected by SAR (3/3/04) & aerials Yellow – detected only by SAR (3/3/04) Blue – detected only by aerials Site 201/05/1014:53
Agreement between SAR and Aerials Probability of Detection (POD) POD = A / (A +C) A = number of pixels of class X (flooded) which were identified correctly as class X C = number of pixels of class X which were not classified as X
Summary and Future Directions The multi-temporal composited SAR images clearly show flooded and non-flooded areas during both high tide and low tide conditions. These results show potential for high resolution remotely sensed imagery to: monitor coastal flooding, delineate inundated areas, and improve hydrodynamic model verification/validation across a variety of coastal landscapes. We will: 1) evaluate model spatial flood predictions and guide improvements in the simulation of the wetting/ drying processes 2) extend this approach temporally to include more dates and spatially across the northern Gulf of Mexico coast to include Alabama and Mississippi
Acknowledgments Support for this part of the project was provided by the NASA Program in Earth Science for Decision Making - Gulf of Mexico Region (Grant #NNX09AT44G) awarded to S. Hagen (PI-UCF). NASA Applied Sciences Program http://games.bio.ucf.edu