Download

1 / 10
100 likes | 193 Views
Exploring Photic Extremum Lines (PELs) for 3D Surface V isualization. Mario Rincón-Nigro Slides based on Xie et al Vis 2007 Presentation. Illustrative visualization. Feature Lines: Contours. Pros: Show strongest cues with model-to-background distinction Cons:

E N D
Exploring PhoticExtremum Lines (PELs) for 3D Surface Visualization Mario Rincón-Nigro Slides based on Xie et al Vis 2007 Presentation
Feature Lines: Contours • Pros: • Show strongest cues with model-to-background distinction • Cons: • Cannot capture structure of the interior of the shape
Feature Lines: Suggestive Contours • Pros: • Extends contours of surface. Captures concave regions • Cons: • Cannot illustrate salient features in convex regions
Feature Lines: Ridge-Valley Lines • Pros: • Captures convex and concave regions • Cons: • View and light independent.
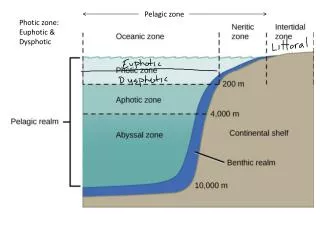
Photonic Extremum Lines (PELs) • [Xie et al. IEEE TVCG 2007] • In 2D image, an edge point is defined as a point at which the gradient magnitude assumes a maximum in the gradient direction. • On 3D surfaces, the PEL is a set of points where the variation of illumination in the direction of its gradient reaches the local maximum.
Photonic Extremum Lines • Captures inner structure • Appears in both convex and concave areas • View and light-dependent
Reported Performance [Xie et al. IEEE TVCG 2007]
Project Goals • Implement PhotumExtremum Lines [Xie et al. IEEE TVCG 2007] • Implement alternative feature lines techniques for comparison purposes: • Contours • Suggestive contours • Ridges and valleys • Visualize different kind of data: • Iso-surfaces from 3D scalar data • Streamtapes/streamsurfaces from 3D vector fields Evaluation is not clear: • User study • Objective metric (?) Report on findings • Be interactive • Use GPU acceleration if required [Xie et al. IEEE TVCG 2007] [Chen et al CGF 2011] [Hummel et al IEEE TVCG 2010]
Work Plan Week 1 (Nov 5): • Literature review • Prepare topic presentation Week 2 (Nov 12) & 3 (Nov 19): • PEL implementation Week 4 (Nov 26): • Implement alternative techniques for feature lines rendering: contours, suggestive contours, ridges and valleys. Week 5 (Dec 3): - Buffer week. Either: • Catch up, if delayed • Try something else (e.g. GPU acceleration), otherwise Week 6 (Dec 10): • Final presentation